PROTECTED SOURCE SCRIPT
ArkWork:: Vector of Candles
Updated
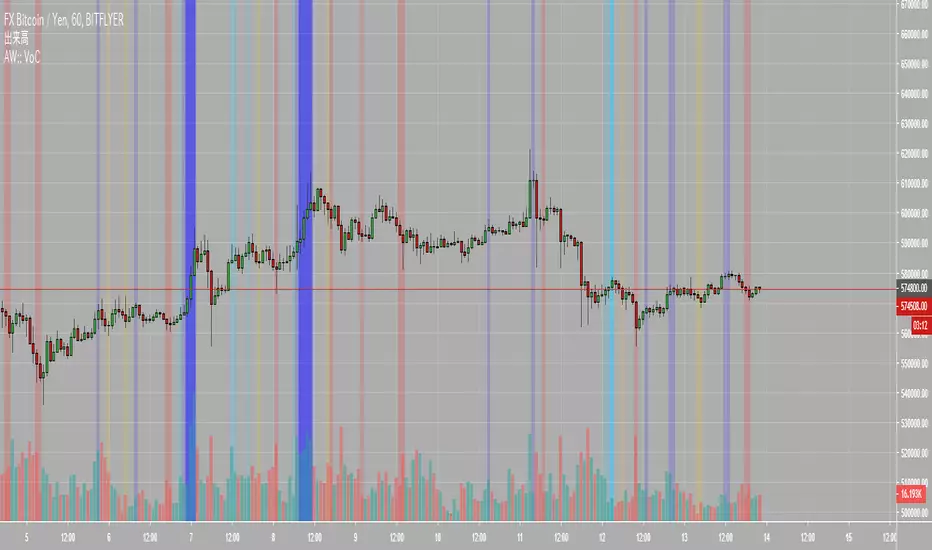
このインジケータは連続した蝋燭とRSIを調べます。
買われ過ぎや売られ過ぎに見える背景にペイントします。
力強い価格変動の場合は、他の抵抗やサポート、修正波、ラインを見てください。
(次のチャンネルレベルへの更新の引き金となる可能性がありますので)
あくまでご参考までに。
This indicator look at the consecutive candle and RSI.
Paint to background of like a overbought or oversold.
If price movement of powerful, please look at the other resistance and support, corrective waves, lines.
(maybe have possibility, to the trigger of update to next channel level)
for your information.
Release Notes
挙動を調整。もし過剰すぎると感じた場合は以下の設定
adjusted the behavior.
If you feel over painted, the following settings
[option]
'Three candles'
disable color 2 and color 4.
Release Notes
refactoring.Release Notes
refactoring.Fixed release note. RSI to StochasticRSI. (tag was correct)
Disclaimer
The information and publications are not meant to be, and do not constitute, financial, investment, trading, or other types of advice or recommendations supplied or endorsed by TradingView. Read more in the Terms of Use.