PROTECTED SOURCE SCRIPT
Max distance from weekly average
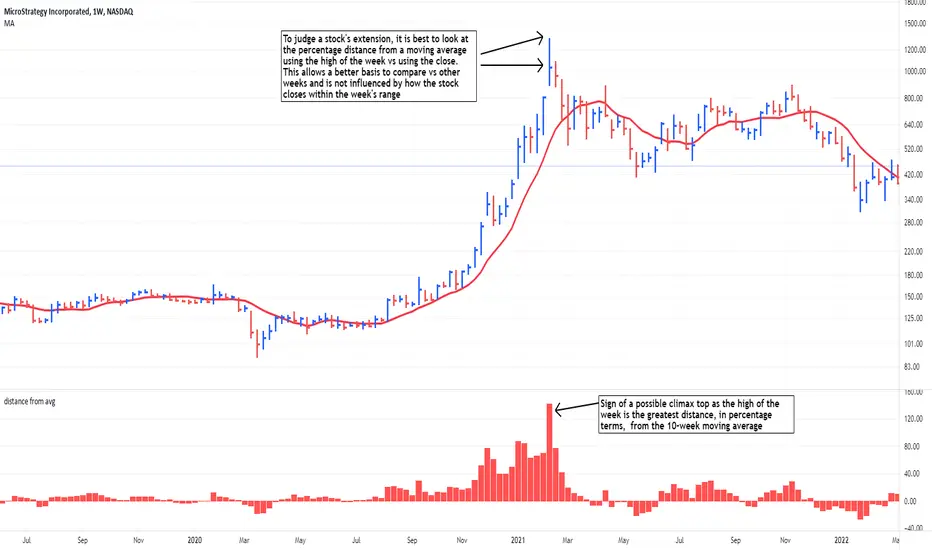
After extended advances, stocks occasionally have a last surge higher and form what is known as a climax top. One way to gauge this is to study what distance the stock is, in percentage terms, vs a moving average. However, most indicators use the close of the bar rather than the high of the bar for this calculation. Stocks that have big reversals may not show to be overextended when looking at a weak closing price. therefore, this tool looks at the high of the week vs the 10-week moving average so that the closing price does not affect comparisons between different weeks.
Get access to CarusoInsights indicators: carusoinsights.com/charting/
Disclaimer
The information and publications are not meant to be, and do not constitute, financial, investment, trading, or other types of advice or recommendations supplied or endorsed by TradingView. Read more in the Terms of Use.