Lowest / Highest From Widget
Updated
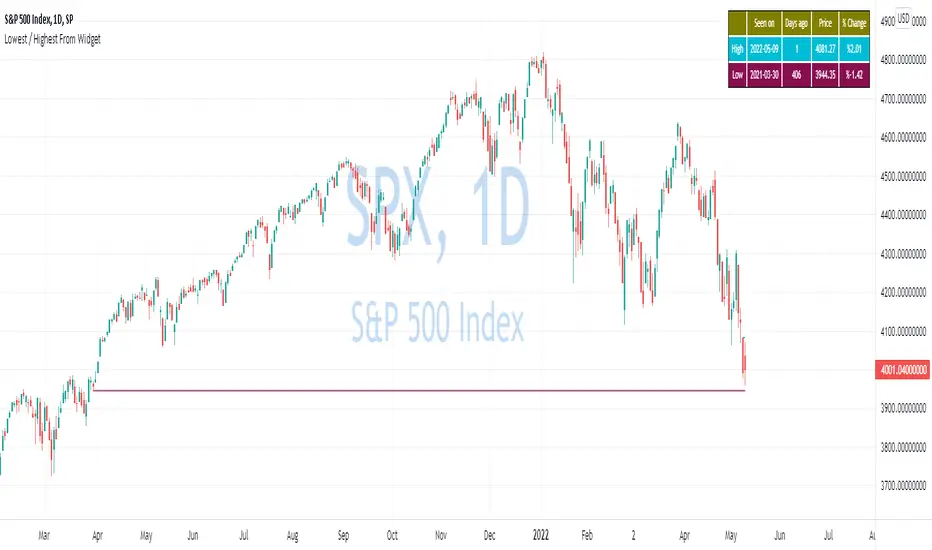
Recent events inspired me to create a small widget that allows you to spot from when current value is lowest / highest.
Just add it to chart and script will compute most recent day when price was higher / lower than current and it will display:
Thanks to MUQWISHI to help me coding it.
Disclaimer
Please remember that past performance may not be indicative of future results.
Due to various factors, including changing market conditions, the strategy may no longer perform as well as in historical backtesting.
This post and the script don’t provide any financial advice.
Just add it to chart and script will compute most recent day when price was higher / lower than current and it will display:
- Line coming from that value to the current one
- A table with previous low/high information
Thanks to MUQWISHI to help me coding it.
Disclaimer
Please remember that past performance may not be indicative of future results.
Due to various factors, including changing market conditions, the strategy may no longer perform as well as in historical backtesting.
This post and the script don’t provide any financial advice.
Release Notes
Small adjustmentsOpen-source script
In true TradingView spirit, the author of this script has published it open-source, so traders can understand and verify it. Cheers to the author! You may use it for free, but reuse of this code in publication is governed by House rules. You can favorite it to use it on a chart.
🎓 Cohort courses: qntly.com/101
💻 Online Courses: qntly.com/courses
📝 Trials: qntly.com/trial
📖 Docs: qntly.com/docs
📰 Newsletter: qntly.com/news
𝕏: qntly.com/x
📩Telegram: qntly.com/tel
💻 Online Courses: qntly.com/courses
📝 Trials: qntly.com/trial
📖 Docs: qntly.com/docs
📰 Newsletter: qntly.com/news
𝕏: qntly.com/x
📩Telegram: qntly.com/tel
Disclaimer
The information and publications are not meant to be, and do not constitute, financial, investment, trading, or other types of advice or recommendations supplied or endorsed by TradingView. Read more in the Terms of Use.