PROTECTED SOURCE SCRIPT
Shotoki Force Index
Updated

Hi,
I publish my private indicator.
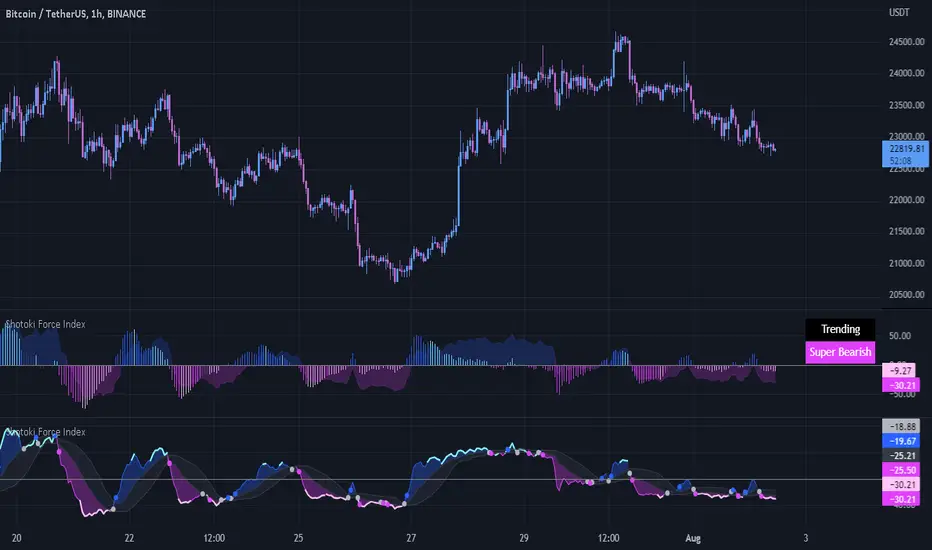
The colored line is called SFI
When it turns blue, it's bullish (enter with a dot)
When it turns purple, it's bearish (enter with dot)
The SFI is "followed" by he bollinger bands.
I use the RV²I as factor
Do not use it allow to trade
I added a RSI option to see when to exit early
Shotoki
Thank's Muxxy for the idea (BB bands)
Release Notes
I changed a bit the RSI_modemode I use to take early exit
Release Notes
I updated the screenshot to make visible the RSIRelease Notes
I added dots for the RSI modeRelease Notes
I added the posibility to change the bollinger bands settings and the smoothing of the SFIRelease Notes
Many new options, you can use other index than the SFI (CCI modified, and Muxxy Force Index)Release Notes
Update of the chart ...Release Notes
I changed the color of the dots when the indexes enter inside the BB BandRelease Notes
code is lighter (removed useless options)I added the extremum lines to see if the SFI is at itstop or its low (options)
Release Notes
I added the ATR confirmation in the preferences. If the ATR is increasing then white dot will appear, else black dots. It's like a volume confirmationRelease Notes
I removed the RSI modeI changed the color of the SFI, by adding extemum values.
If the line becomes lighter then it's more dangerous to enter a trade. I try not to at least
I can also exit my trade if the line become darker again
Release Notes
Chart updateRelease Notes
This time, big changes !I changed a bit the display of the settings and preferences
You can now chose to display a Board helping you to understand the current trend / reset of the oscilator
You can also display an histogram
- The area is the current SFI line, when it's above 0 we are more likely to be in a bull trend
- The histogram represent the difference between the SFI line and the upper/lower BBand regarding where it crosses.
- The Board is here to help you understand the histogram
Release Notes
New features available !- I changed the settings, I tried to make it clearer
- I added some filters for the histogram mode
- You can display now the SEF "pressure. SEF is one of my indicator, I use it to exit ealier so I appears as crosses above/below the SFI line
Release Notes
I updated the Settings to have a easier experience (I guess) and a better displayDisclaimer
The information and publications are not meant to be, and do not constitute, financial, investment, trading, or other types of advice or recommendations supplied or endorsed by TradingView. Read more in the Terms of Use.