OPEN-SOURCE SCRIPT
Random Price Action Visible Chart
Updated

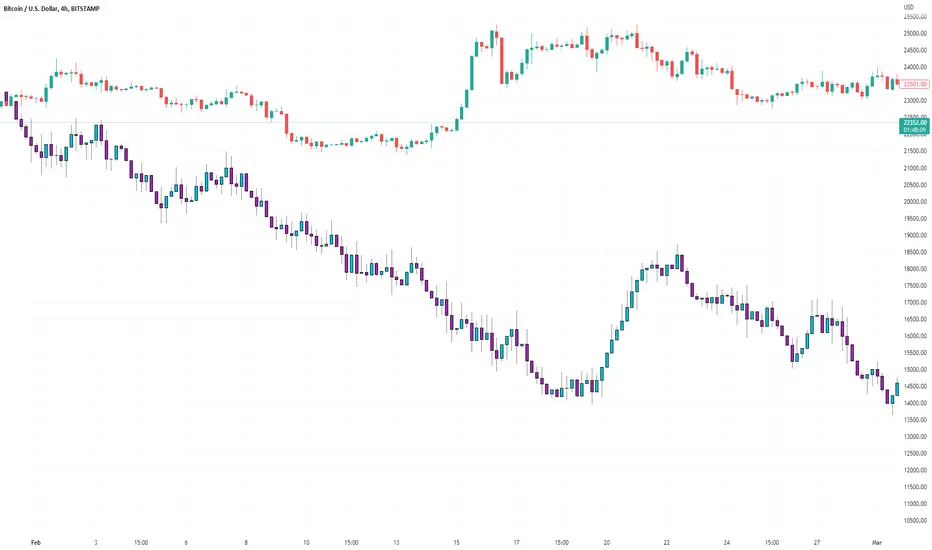
plots randomly generated price (closing basis) from LHS of the chart. Re-plots each time you scroll
-just a curiosity really; perhaps a lesson in seeing patterns where there are none; 'fooled by randomness' etc.
-always anchors/starts from the real close of the asset on the visible Left hand side of the chart.
-adjust ATR as you like (bigger = probably more reliable/realistic).
-adjust ATRmultiple as you like (discretionary; basically how many ATR ranges above/below last bar's random close, will the maximum random value above/below be; default is 1.5x (arbitrary).
Release Notes
-Fixed errors. Added custom start plot point. Added tooltips.Release Notes
-added ability to plot whole candles as well as close; plot candles is defaultRelease Notes
-fixed logic in wick printing. Sidenote: If you want to independently change the wick/tail random range; edit line 25Release Notes
-added independent wick volatility input. Cleaned up code & formattingOpen-source script
In true TradingView spirit, the author of this script has published it open-source, so traders can understand and verify it. Cheers to the author! You may use it for free, but reuse of this code in publication is governed by House rules. You can favorite it to use it on a chart.
You can buy me a coffee here...
PayPal.Me/twingall
BTC: 3JrhUwNRnKyqhaa1n1AXKeAubNeEFoch6S
ETH erc20: 0x4b0400B1c18503529ab69611e82a934DDe4Ab038
ETH bep20: 0x1F0f03F184079bb1085F8C9dF3a8191C9f5869B3
PayPal.Me/twingall
BTC: 3JrhUwNRnKyqhaa1n1AXKeAubNeEFoch6S
ETH erc20: 0x4b0400B1c18503529ab69611e82a934DDe4Ab038
ETH bep20: 0x1F0f03F184079bb1085F8C9dF3a8191C9f5869B3
Disclaimer
The information and publications are not meant to be, and do not constitute, financial, investment, trading, or other types of advice or recommendations supplied or endorsed by TradingView. Read more in the Terms of Use.