PROTECTED SOURCE SCRIPT
Market Pulse
Updated

4 Market Stages:
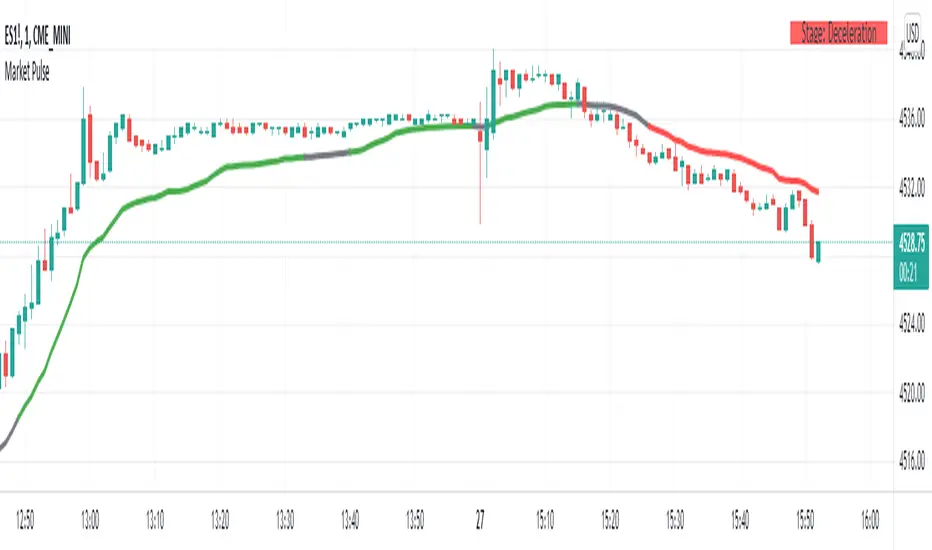
The Market Pulse indicator simplifies the market into 4 separate stages:
Full video tutorial breaking down the 4 different market stages can be found on our website.
How Does it Work?
The Market Pulse line is plotted using a 10-period Variable Moving Average (VMA). This works as a good substitute for moving averages, and allows you to easily determine trend, in a process-driven fashion, without leaving room for over-analyzing ( ie . are these moving averages stacked, what if x is above y, but a is below b, etc.). The color of the Market Pulse line is determined by the relationship between three Volume Weighted Moving Averages ( VWMA ): 8-period VWMA , 21-period VWMA and 34-period VWMA .
The Market Pulse line will change colors, based on the following conditions:
Questions?
Feel free to send us an email if you have any questions.
Special thanks to Nick (Nick42_for_win) for the assist with translating our Market Pulse indicator for TV traders.
The Market Pulse indicator simplifies the market into 4 separate stages:
- Acceleration - Market in confirmed uptrend
- Accumulation - Market in uptrend, but moving more cautiously
- Deceleration - Market in confirmed downtrend
- Distribution - Market in downtrend, but moving more cautiously
Full video tutorial breaking down the 4 different market stages can be found on our website.
How Does it Work?
The Market Pulse line is plotted using a 10-period Variable Moving Average (VMA). This works as a good substitute for moving averages, and allows you to easily determine trend, in a process-driven fashion, without leaving room for over-analyzing ( ie . are these moving averages stacked, what if x is above y, but a is below b, etc.). The color of the Market Pulse line is determined by the relationship between three Volume Weighted Moving Averages ( VWMA ): 8-period VWMA , 21-period VWMA and 34-period VWMA .
The Market Pulse line will change colors, based on the following conditions:
- Green line - when the 8-period VWMA is greater than the 21-period VWMA and the 21-period VWMA is greater than the 34-period VWMA (Acceleration stage)
- Red line - when the 8-period VWMA is less than the 21-period VWMA and the 21-period VWMA is less than the 34-period VWMA (Deceleration stage)
- Gray line - when the three VWMAs are not stacked bullishly or bearishly, and there is no clear trend clarity (Accumulation stage if close >= VMA, Distribution stage if close < VMA)
Questions?
Feel free to send us an email if you have any questions.
Special thanks to Nick (Nick42_for_win) for the assist with translating our Market Pulse indicator for TV traders.
Release Notes
Fixed bug to allow for user to change source price and length via input menu for the Market Pulse calculation and plot. Credit to Nick42_for_win for reporting the bug, and suggesting a fix.Disclaimer
The information and publications are not meant to be, and do not constitute, financial, investment, trading, or other types of advice or recommendations supplied or endorsed by TradingView. Read more in the Terms of Use.