OPEN-SOURCE SCRIPT
Average True Range - Improved
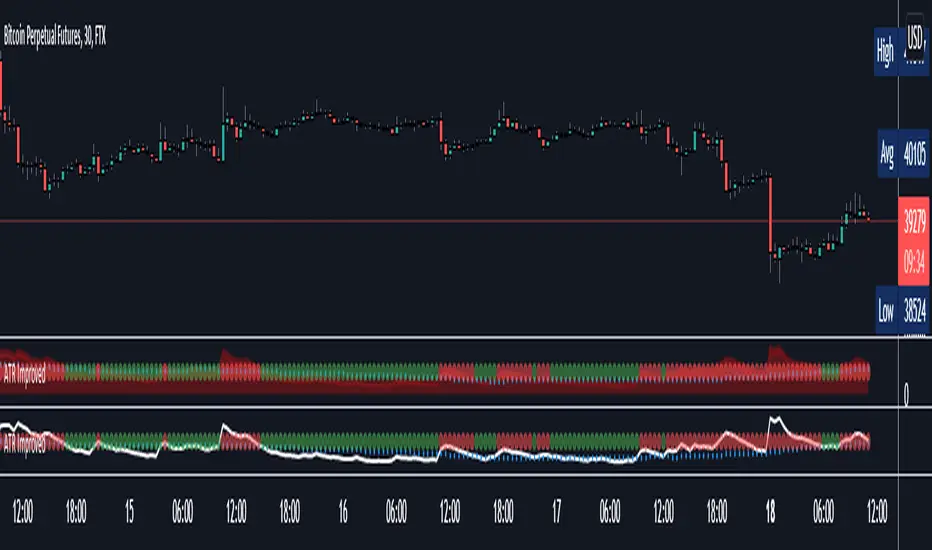
Average True Range - Improved is a small variation I have made to the standard ATR indicator. It will test the current ATR against the Historic Average ATR of your preference to see if the current volatility is high or low.
Once it has determined if it is high or low it will color code the circles at the top based on this information. Green means the current volatility is low and red means the current volatility is higher than the historic average.
In the settings I have also placed a couple styles, if you wish to show the ATR and Historic ATR in percent format instead of normal you can turn them on in the style settings. If you are using the percent format I recommend setting the Precision to 2-3 decimal places.
I hope you all enjoy this indicator, if you have any questions please feel free to post them in the comments.
Website
oasistrading.io
Meet the Team.
twitter.com/DejaBrewTrades
tradingview.com/u/gyromatical/
oasistrading.io
Meet the Team.
twitter.com/DejaBrewTrades
tradingview.com/u/gyromatical/
Open-source script
In true TradingView spirit, the author of this script has published it open-source, so traders can understand and verify it. Cheers to the author! You may use it for free, but reuse of this code in publication is governed by House rules. You can favorite it to use it on a chart.
Disclaimer
The information and publications are not meant to be, and do not constitute, financial, investment, trading, or other types of advice or recommendations supplied or endorsed by TradingView. Read more in the Terms of Use.