OPEN-SOURCE SCRIPT
Hurst Spectral Analysis SwamiChart
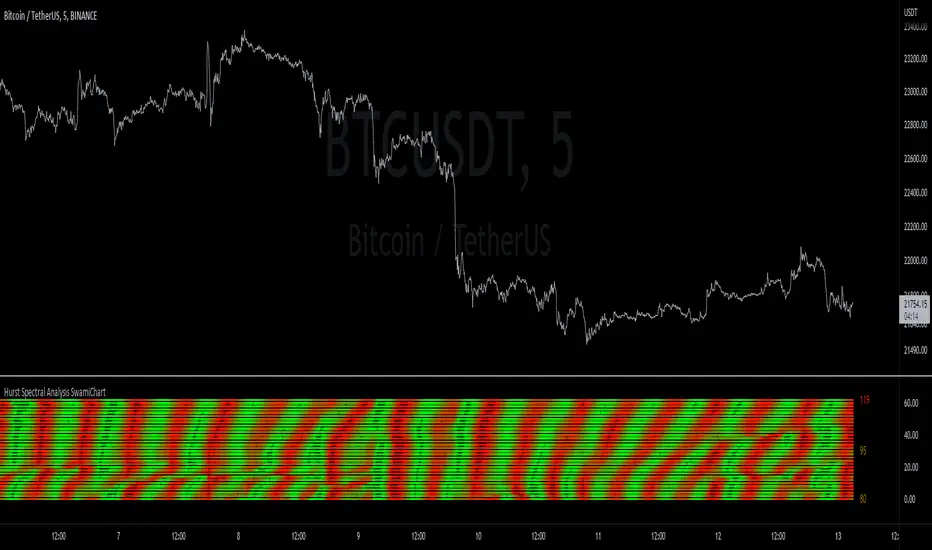
Having a hard time deciding which wavelength to use for a Hurst analysis? Try a handful at once! SwamiCharts by John Ehlers offers a comprehensive way to visualize an indicator used over a range of lookback periods. The Spectral Analysis SwamiChart shows the bullish or bearish state of a spectrum of bandpasses over a user-defined range of wavelengths. The trader simply selects a bandwidth, a base wavelength, and a step/multiple to see the Spectral Analysis SwamiChart. A vertical column of green or red tends to indicate a very bullish or bearish moment in time, meaning that all bandpasses in the analyzed spectrum are in a bullish or bearish orientation simultaneously.
🏆 Shoutout to DavidF at Sigma-L for all the helpful information, conversations together, & indicator feedback.
🏅Shoutout to HPotter for the bandpass code, and shoutout to TerryPascoe for sharing it with me
🏆 Shoutout to DavidF at Sigma-L for all the helpful information, conversations together, & indicator feedback.
🏅Shoutout to HPotter for the bandpass code, and shoutout to TerryPascoe for sharing it with me
Made w/ ❤ by @BarefootJoey ✌💗📈
Open-source script
In true TradingView spirit, the author of this script has published it open-source, so traders can understand and verify it. Cheers to the author! You may use it for free, but reuse of this code in publication is governed by House rules. You can favorite it to use it on a chart.
Disclaimer
The information and publications are not meant to be, and do not constitute, financial, investment, trading, or other types of advice or recommendations supplied or endorsed by TradingView. Read more in the Terms of Use.