PROTECTED SOURCE SCRIPT
STrading Indicator

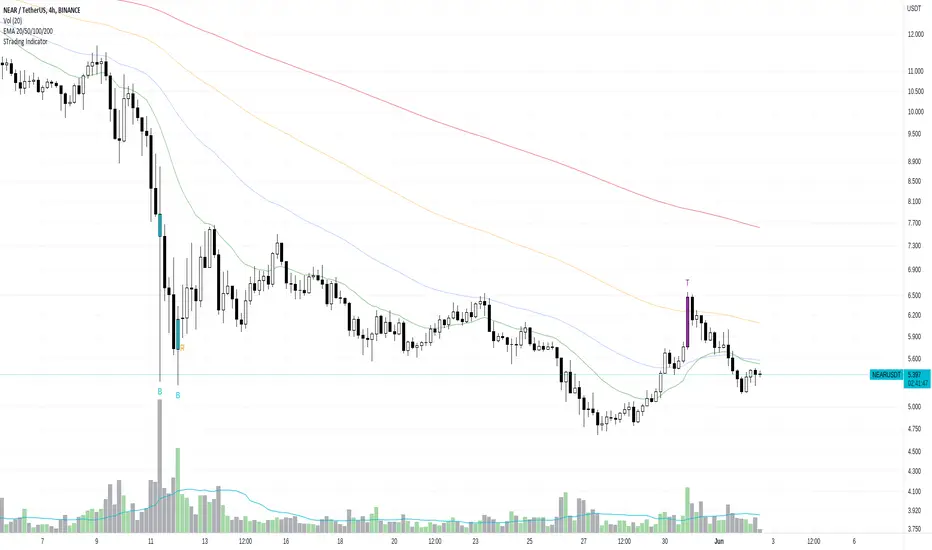
This indicator tries to identify a local bottom or a local top in the trend by using volume, RSI and raw candle data.
This indicator is meant to be used as a support to your analysis, it should not be used at his own. You should look for confluence with other indicators.
- If the candle is Aqua and has a B, it indicates a possible local bottom.
- If the candle is Purple and has a T, it indicates a possible local top.
- If the candle is Orange and has a R, it indicates a possible "reversal" or trend change confirmation.
This indicator is meant to be used as a support to your analysis, it should not be used at his own. You should look for confluence with other indicators.
Disclaimer
The information and publications are not meant to be, and do not constitute, financial, investment, trading, or other types of advice or recommendations supplied or endorsed by TradingView. Read more in the Terms of Use.