PROTECTED SOURCE SCRIPT
KCW
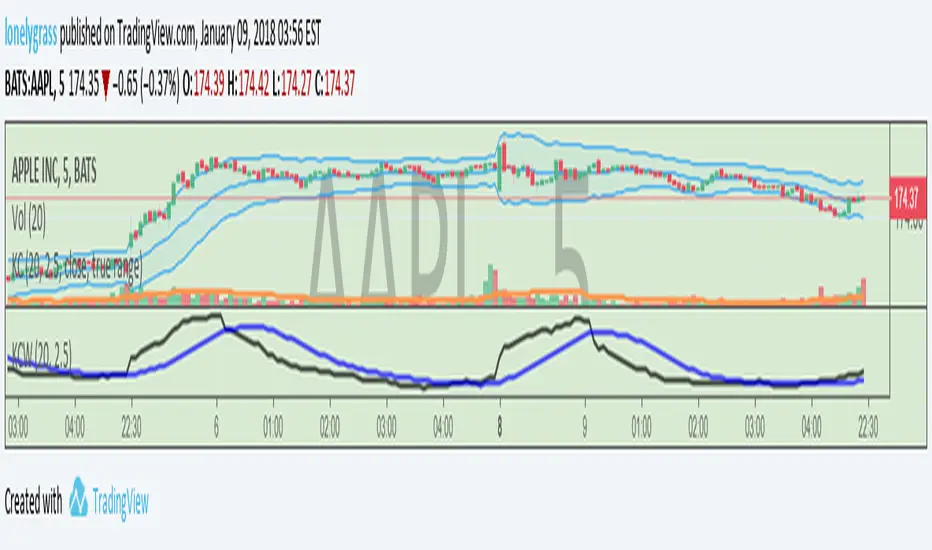
This TA is called Keltner Channel Width(KCW). It consists of a black line measuring the percentage difference between the upper and the lower channel and a blue line which is the 20-sma of KCW. Based on true range, KCW can be interpreted in two ways: (1) falling width reflects decreasing volatility and (2) rising width reflects increasing volatility.
KCW is a powerful weapon for identifying The Squeeze. This occurs when volatility falls to a very low level, as evidenced by decresing value (negative crossover). After a Squeeze, might be a positive crossover, it signals the start of a new move. A new advance starts with a Squeeze and subsequent break above the upper channel. A new decline starts with a Squeeze and subsequent break below the lower channel.
Done for today. Look forward to your comments and most importantly, your subscription.
Lonelygrass
Disclaimer
The information and publications are not meant to be, and do not constitute, financial, investment, trading, or other types of advice or recommendations supplied or endorsed by TradingView. Read more in the Terms of Use.