PROTECTED SOURCE SCRIPT
VWMA Volatility Oscillator

VWMA Volatility Oscillator
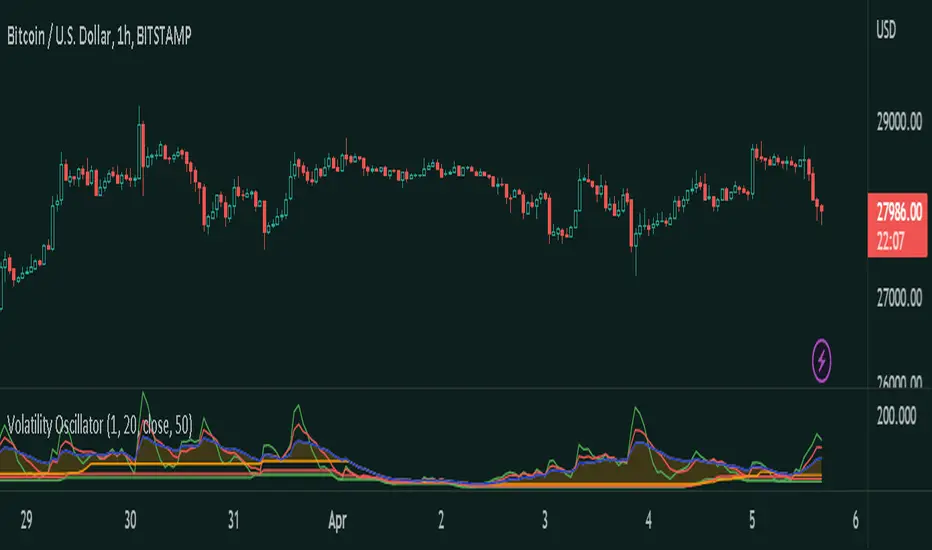
This oscillator uses Volume Weighted Moving Averages to plot the volume. When the average is on the bottom then there is a chance that volatility contractions could be happening and a expansion could happen soon. When the average can be seen "high" like peaking then this could mean that there already is a lot of volume and the expansion is already happening.
What are contractions and expansions?
Contractions are periods in the markets where the price range gets tighter signifying decreasing volatility.
After contractions, Expansions will occur which is a strong movement upwards or downwards and the range increases, which shows an increase in volatility.
How to use this indicator
The indicator has 3 VWMA lines. The indicator also has a bottom range by getting the lowest points of each of the VWMA lines. If the VWMA lines are at the bottom ranges this can signify low volatility and a contraction. This can mean that at any moment a expansion will happen and a possible pump or dump.
Link Tree: linktr.ee/tradersendeavors
Access our indicators: patreon.com/user?u=80987417
Access our indicators: patreon.com/user?u=80987417
Disclaimer
The information and publications are not meant to be, and do not constitute, financial, investment, trading, or other types of advice or recommendations supplied or endorsed by TradingView. Read more in the Terms of Use.