OPEN-SOURCE SCRIPT
New Map For Traders
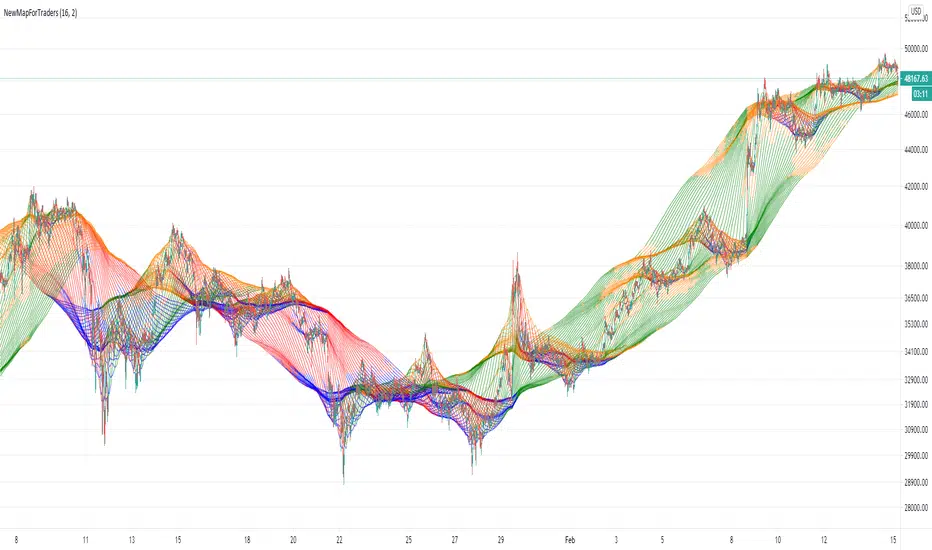
Using previous principles, This setup plots 60 moving averages on the chart. The averages are colored using a normalized oscillation technique (FFT).
To achieve the same display as above, put the same indicator twice and set the 'osx' parameter of one to 0 and the other to 2.
Feel free to play with the 'mul' parameter in ranges between 1-90. Most useful ranges will be 4-16 in my opinion.
Leave me a message if you'd like to explore the behaviors of the fractal dimension further ;)
Open-source script
In true TradingView spirit, the author of this script has published it open-source, so traders can understand and verify it. Cheers to the author! You may use it for free, but reuse of this code in publication is governed by House rules. You can favorite it to use it on a chart.
Disclaimer
The information and publications are not meant to be, and do not constitute, financial, investment, trading, or other types of advice or recommendations supplied or endorsed by TradingView. Read more in the Terms of Use.