OPEN-SOURCE SCRIPT
XYZ Super Fibonacci Channel Cluster
Updated
Simple setups
- Just input two different ema, X and Y.
- Multiple = input Phi factor (ex: 0.38 , 0.618 , 1.618 , 3.14)
Usage
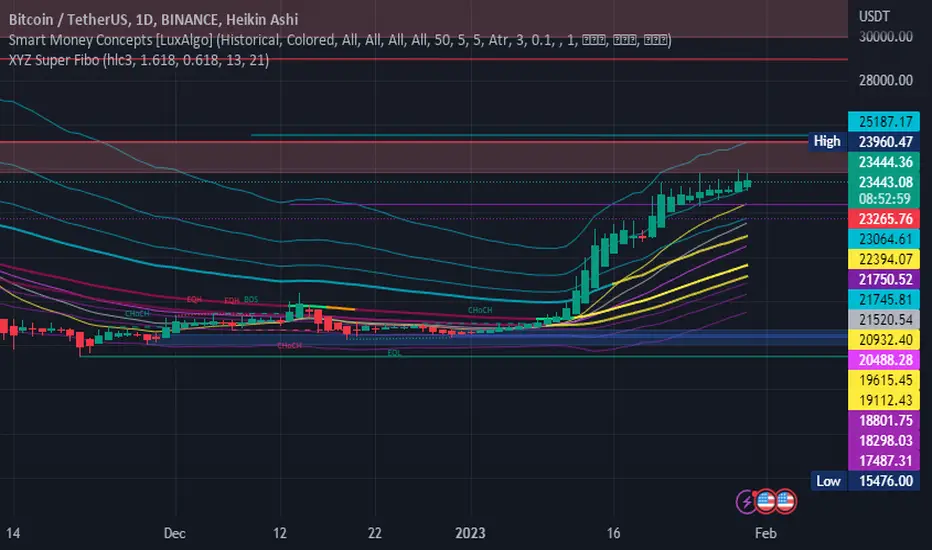
Grouping movements into channels to identify trend acceleration and deceleration
Example usability in the BTC/USD trading pair (timeframe = 1D) =>
Input Setups
- Source = hlc3
- Multiplier = 2
- X Ema = 13
- Y Ema = 21
How to identify acceleration and deceleration?
- H_1 to H_2 => Bullish but no acceleration (because at same top level border).
- H_2 to H_3 => Bullish with acceleration (go up to another top level border).
- H_3 to H_4 / H_4 to H_5 => Bullish deceleration (because drop to another top level border).
- L_1 to L_2 => Bearish signal (because fall below EMA-super and touch the bottom border of Super Channel).
- L_2 to L_3 => Bearish acceleration (drop to another bottom level border).
- L_3 to L_4 => Bearish deceleration (go up to another bottom level border).
Release Notes
V.2- Added a multiplier options and updating tooltip
- Default setup changes
Release Notes
Update- Separate Upper Multiplier and Lower Multiplier
- Ema XYZ enabled
- Coloring improvement
[*} Term improvement
Release Notes
- Updated script
- Added channel last length
- Default changes
Open-source script
In true TradingView spirit, the author of this script has published it open-source, so traders can understand and verify it. Cheers to the author! You may use it for free, but reuse of this code in publication is governed by House rules. You can favorite it to use it on a chart.
Disclaimer
The information and publications are not meant to be, and do not constitute, financial, investment, trading, or other types of advice or recommendations supplied or endorsed by TradingView. Read more in the Terms of Use.