OPEN-SOURCE SCRIPT
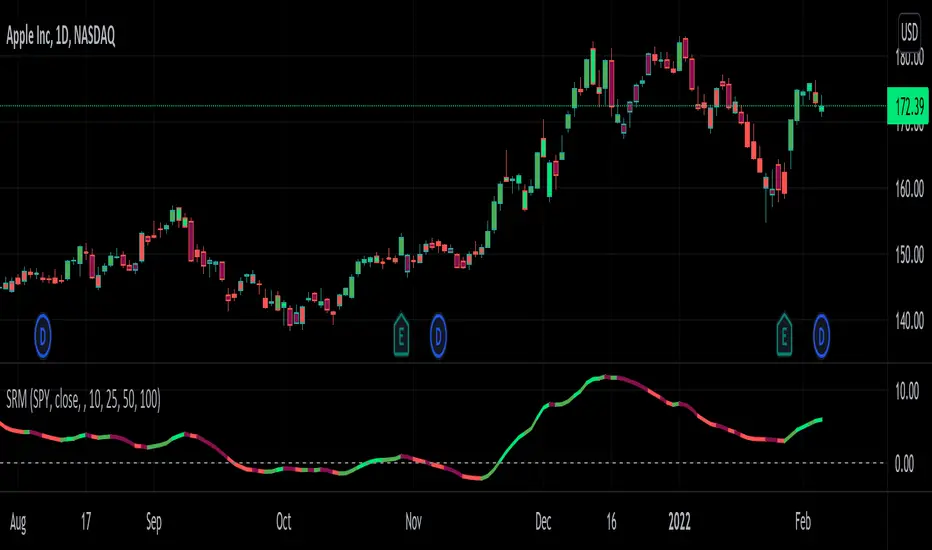
Stock Rotation Model [CC]

This is an original indicator so a true hidden gem in my opinion. I based this idea off of the work by Giorgos Siligardos (Stocks and Commodities Aug 2012) with his indicator called the Sector Rotation Model. This indicator is best used as a trend confirmation in combination with another indicator such as a leading indicator. This will show you how strong the current stock you are looking at is compared to the S&P 500 which almost everyone uses as a relative strength comparison. Feel free to change the default lengths if you would like as these were just the settings that I liked the best overall. Let me know if you find any good combos that works for most stocks in general. I have included strong buy and sell signals in addition to normal ones so strong signals are darker in color and normal signals are lighter in color. Buy when the line turns green and sell when it turns red.
Let me know if there are any other indicators or scripts you would like to see me publish!
Let me know if there are any other indicators or scripts you would like to see me publish!
Open-source script
In true TradingView spirit, the author of this script has published it open-source, so traders can understand and verify it. Cheers to the author! You may use it for free, but reuse of this code in publication is governed by House rules. You can favorite it to use it on a chart.
I created the largest stock indicator library:
github.com/ooples/
Custom Indicator Requests:
forms.gle/ouMffZR3dQ8bSJQG7
Tips are appreciated:
paypal.me/cheatcountry
patreon.com/cheatcountry
github.com/ooples/
Custom Indicator Requests:
forms.gle/ouMffZR3dQ8bSJQG7
Tips are appreciated:
paypal.me/cheatcountry
patreon.com/cheatcountry
Disclaimer
The information and publications are not meant to be, and do not constitute, financial, investment, trading, or other types of advice or recommendations supplied or endorsed by TradingView. Read more in the Terms of Use.