OPEN-SOURCE SCRIPT
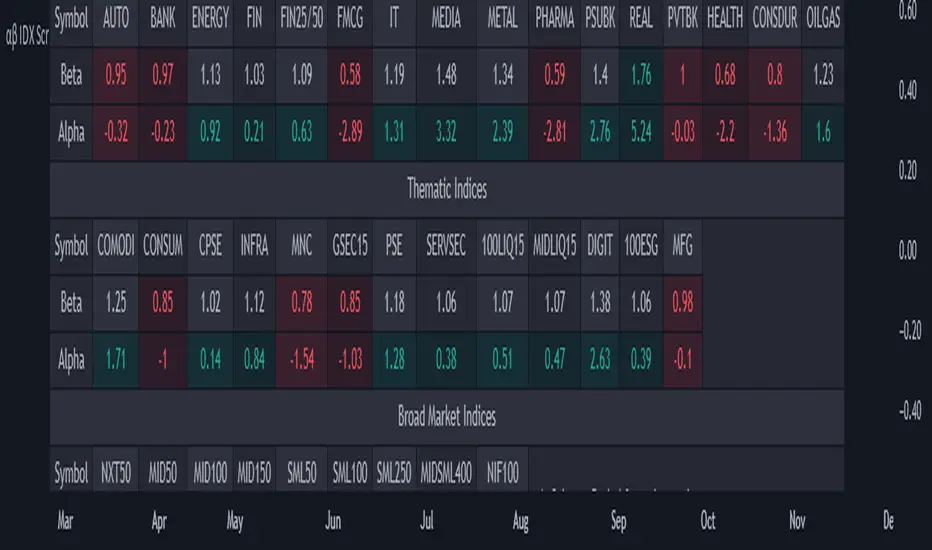
Screener: Alpha & Beta Index
Updated

This is a Index Screener which can short list the major Sectors contributing to NIFTY movement that day.
This helps in sector based trading, in which we can trade in the stocks which falls under that particular sector.
No need to roam around all the stocks in the whole watchlist.
It is recommended to create sector wise watchlist of all sectors. It will be easier to concentrate in only one sector.
For example in IT sector index there are certain stocks which contribute to the movement of IT sector.
This will be available in NSE (or exchange website).
For detailed description check out the descriptions in my previous 2 Alpha and Beta indicators.
Combine and use this screener with my previous Alpha & Beta indicator.
Release Notes
Updated position.Release Notes
Updated on: 19 Nov 2023Enhanced Analysis Features::
- The formula has been updated.
- Evaluate all sectors against the benchmark index using alpha and beta metrics.
- Gain insights into each sector's performance to make informed trading decisions.
- Can include up to 38 symbols due to TradingView's request limit of 40.
- Broad Market Indices have only first 9 out of 16 symbols.
- Organized and readable code for better user understanding.
- Easily analyze additional symbols by replacing indicators in the Paste Symbol box.
- Offers flexibility and customization options for users.
How to Use:
- Step 1 - Choose the desired period in settings.
- Step 2 - Match the chart timeframe with the selected period for accurate results (e.g., 'Medium Term - 52 W (1Y)' corresponds to 'W' for Weekly).
Open-source script
In true TradingView spirit, the author of this script has published it open-source, so traders can understand and verify it. Cheers to the author! You may use it for free, but reuse of this code in publication is governed by House rules. You can favorite it to use it on a chart.
Disclaimer
The information and publications are not meant to be, and do not constitute, financial, investment, trading, or other types of advice or recommendations supplied or endorsed by TradingView. Read more in the Terms of Use.