OPEN-SOURCE SCRIPT
MarketSmith Daily Market Indicators
Updated
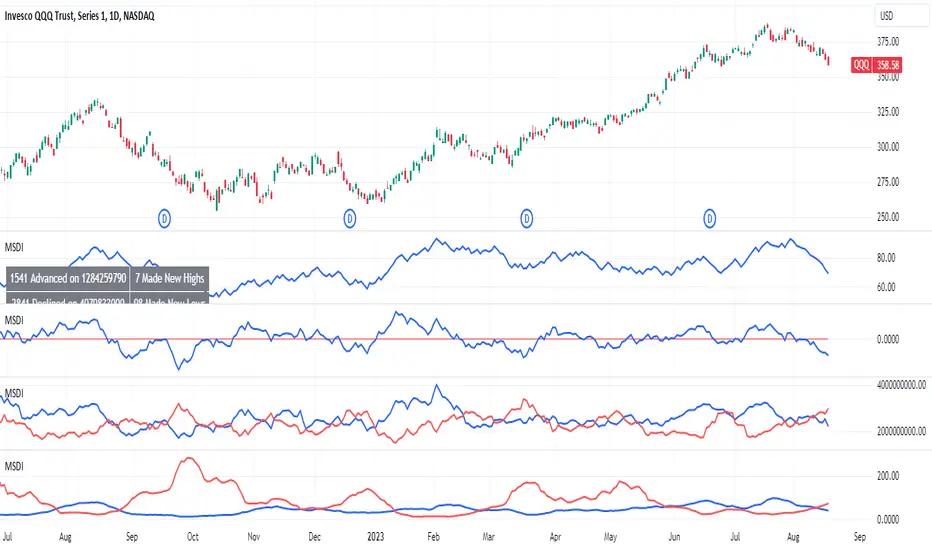
MarketSmith Daily Market Indicators is designed to mimic the Daily Market Indicators tab found in MarketSmith. This tab contains 4 different secondary indicators to help gauge the health of the overall market.
This indicator allows you to choose which of the 4 indicators to show, as well as which index to pull data from, Nasdaq or NYSE. There is also a snapshot table showing the following:
Now let's look at the 4 indicators and how they work.
Advance/Decline Line
Plots the number of advancing shares vs the number of declining shares. Heavily weighted index stocks can skew price action, this line helps reveal that and whether most stocks are aligned with the trend.

Short Term Overbought/Oversold Oscillator
A 10-day moving average of the number of stocks moving up in price less the number of stocks moving down in price.

10 Day Moving Average of Up & Down Volume
Two 10 day moving averages to represent the volume of all stocks. Blue line: total volume of all stocks moving up in price. Red line: the total volume of all stocks moving down in price.

10 Day Moving Average of New Highs & New Lows
Two 10-day moving average to represent stocks making new highs and new lows. Blue line: The number of stocks making new price highs. Red line: The number of stocks reaching new lows.

Note this indicator is designed to work on a daily time frame chart. Data typically updates 90 minutes after the close. Data may differ from Marketsmith due to different providers, however the general trends are the same.
This indicator allows you to choose which of the 4 indicators to show, as well as which index to pull data from, Nasdaq or NYSE. There is also a snapshot table showing the following:
- # of stock advancing and up volume
- # of stocks declining and down volume
- # of stock unchanged and unchanged volume
- # of stocks making new highs and new lows
Now let's look at the 4 indicators and how they work.
Advance/Decline Line
Plots the number of advancing shares vs the number of declining shares. Heavily weighted index stocks can skew price action, this line helps reveal that and whether most stocks are aligned with the trend.
Short Term Overbought/Oversold Oscillator
A 10-day moving average of the number of stocks moving up in price less the number of stocks moving down in price.
10 Day Moving Average of Up & Down Volume
Two 10 day moving averages to represent the volume of all stocks. Blue line: total volume of all stocks moving up in price. Red line: the total volume of all stocks moving down in price.
10 Day Moving Average of New Highs & New Lows
Two 10-day moving average to represent stocks making new highs and new lows. Blue line: The number of stocks making new price highs. Red line: The number of stocks reaching new lows.
Note this indicator is designed to work on a daily time frame chart. Data typically updates 90 minutes after the close. Data may differ from Marketsmith due to different providers, however the general trends are the same.
Release Notes
Two new features in this update. - Option to see a moving average of the Advance/Decline Lines
- Option to display the daily net highs/lows as a histogram
Release Notes
Fixed a bug in the offset option (horizontal to vertical) for the advance decline lines. Release Notes
Update includes ability to show or hide a watermark for each different data point. Trusted Pine programmer. Send me a message for script development.
Open-source script
In true TradingView spirit, the author of this script has published it open-source, so traders can understand and verify it. Cheers to the author! You may use it for free, but reuse of this code in publication is governed by House rules. You can favorite it to use it on a chart.
Disclaimer
The information and publications are not meant to be, and do not constitute, financial, investment, trading, or other types of advice or recommendations supplied or endorsed by TradingView. Read more in the Terms of Use.