OPEN-SOURCE SCRIPT
Relative Volume Strength Index
Updated
RVSI is an alternative volume-based indicator that measures the rate of change of average OBV.
How to read a chart using it?
It looks simple, but it's powerful!
I'd use RVSI in combination with price-based indicators.
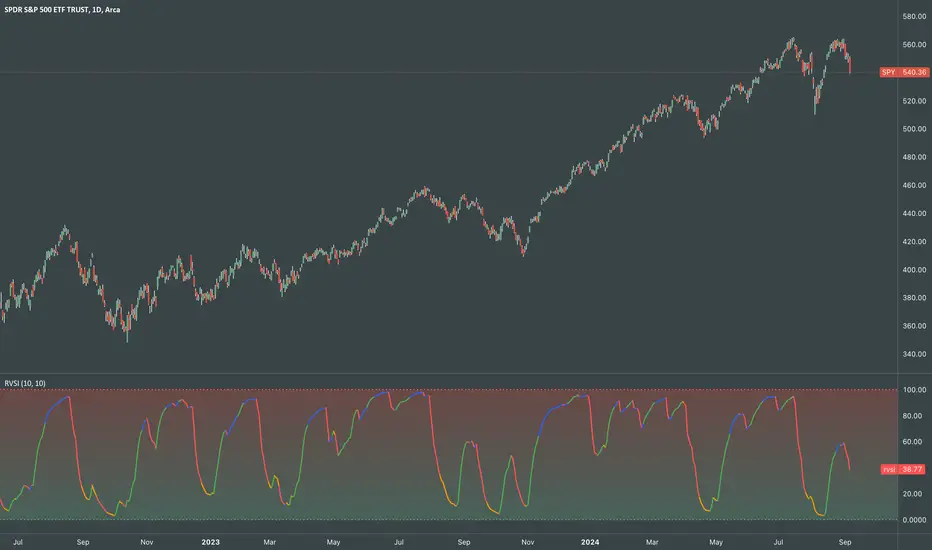
How to read a chart using it?
- First signal to buy is when you see RVSI is close to green oversold levels.
- Once RVSI passes above it's orange EMA, that would be the second alert of accumulation.
- Be always cautious when it reaches 50 level as a random statistical correction can be expected because of "market noises".
- You know it's a serious uptrend when it reaches above 75 and fluctuates there, grading behind EMA.
- The best signal to sell would be a situation where you see RVSI passing below it's EMA when the whole thing is close to Red overbought level
It looks simple, but it's powerful!
I'd use RVSI in combination with price-based indicators.
Release Notes
Update:Added visual intuitiveness
Release Notes
updRelease Notes
Effective increase in responsiveness due to a slight change in formula.Release Notes
- Color-coded rate of change relative to its linear regression
- Changed formula to enhance the responsiveness
🏛️🌐
Open-source script
In true TradingView spirit, the author of this script has published it open-source, so traders can understand and verify it. Cheers to the author! You may use it for free, but reuse of this code in publication is governed by House rules. You can favorite it to use it on a chart.
Disclaimer
The information and publications are not meant to be, and do not constitute, financial, investment, trading, or other types of advice or recommendations supplied or endorsed by TradingView. Read more in the Terms of Use.