PROTECTED SOURCE SCRIPT
MTF Radar_vt

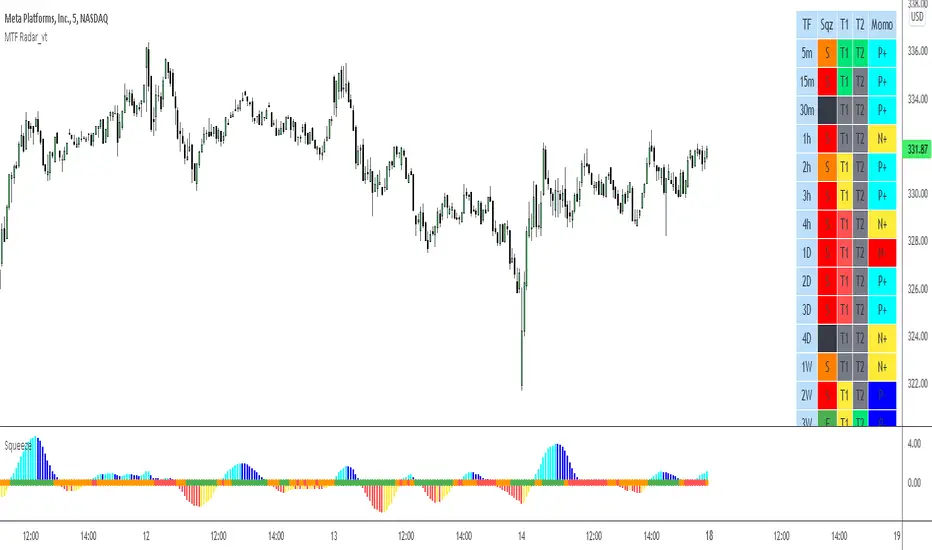
MTF Radar is like your car dashboard for trading. It is your X-ray machine and, in one glance, you know what price is doing in all major time frames, from 5m to 1Q, without having to flip through multiple charts. Simple and visual!
The Sqz column indicates whether a stock is in consolidation(i.e. in squeeze) or in expansion (fired). Color denotes different compression levels: tight - black, medium - red, low - orange, green - fired.
T1 and T2 are two different trend systems:
T1 - green = bullish trend, red = bearish trend, gray = side ways, yellow - trend change
T2 - green = bullish trend, red = bearish trend, gray = side ways
T1 is a more sensitive system compared to T2.
Momo column shows squeeze momentum bars with matching color.
P+: momentum is positive and increasing. Light blue.
P-: momentum is positive and decreasing. Dark blue.
N+: momentum is negative and increasing. Yellow.
N-: momentum is negative and decreasing. Dark blue.
MTF Radar_vt is a light version of the full indicator and covers:
- most futures market
- 30 stocks in Dow Index
- Index and sector ETFs : SPY, QQQ, DIA, IWM, XLE, XLF, XLU, GDX, XLK, XLV, XLY, XLB, ITB, XRT, SMH, IBB, KRE, XLC, GDXJ, KBE
- Some key stocks: AAPL, AMZN, FB, GOOGL, TSLA, NVDA, NFLX
- Forex pairs: DXY,AUDCAD,AUDJPY,AUDNZD,AUDUSD,EURCAD,EURGBP,EURJPY,EURUSD,GBPJPY,GBPUSD,NZDUSD,USDCAD,USDJPY
Full version works on all stocks and assets. If you like this indicator and require the full version, please contact the author.
Credits:
-> John Carter - creator of TTM Squeeze and TTM Squeeze Pro
-> Lazybear's interpretation of the TTM Squeeze: Squeeze Momentum Indicator
Disclaimer
The information and publications are not meant to be, and do not constitute, financial, investment, trading, or other types of advice or recommendations supplied or endorsed by TradingView. Read more in the Terms of Use.