OPEN-SOURCE SCRIPT
Up-Down Volume NYSE-Buschi
Updated
English:
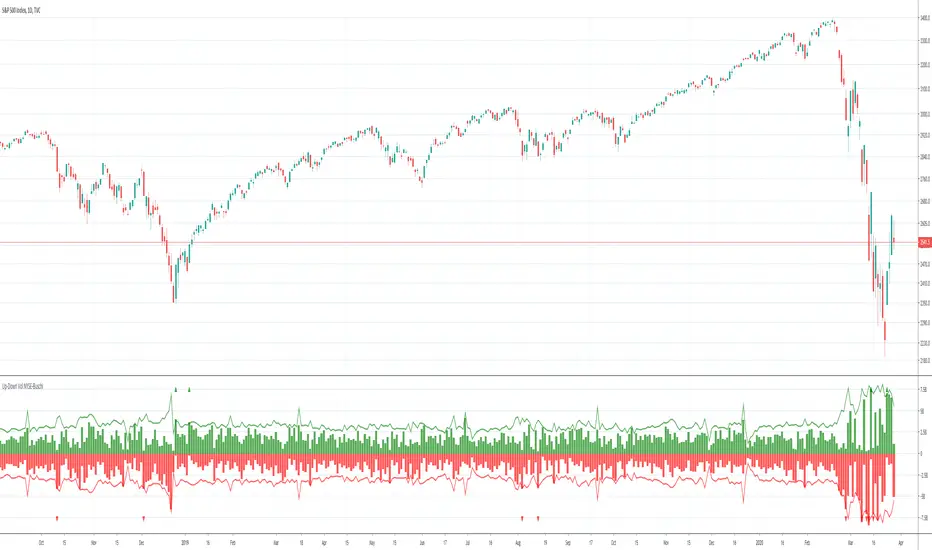
This indicator shows the NYSE's up volume (green) and down volume (red).
Extreme trading days with more than 90 % up or down volume are marked via lines (theoretically values) and triangles (breaches).
Deutsch:
Dieser Indikator zeigt das Aufwärts- (grün) und Abwärts-Volumen (rot) der NYSE.
Extreme Handelstage mit mehr als 90 % Aufwärts- oder Abwärts-Volumen ist gekennzeichnet über Linien (theoretische Werte) und Dreiecke (Überschreitungen).
Release Notes
English:
Changed the symbol name. The old one is no longer functioning.
Deutsch:
Änderung des Symbolnamens, da der alte nicht mehr funktioniert.
Release Notes
English: Again, changed the symbol name. The old one is no longer functioning.
Deutsch:
Wiederholte Änderung des Symbolnamens, da der alte nicht mehr funktioniert.
Open-source script
In true TradingView spirit, the author of this script has published it open-source, so traders can understand and verify it. Cheers to the author! You may use it for free, but reuse of this code in publication is governed by House rules. You can favorite it to use it on a chart.
Disclaimer
The information and publications are not meant to be, and do not constitute, financial, investment, trading, or other types of advice or recommendations supplied or endorsed by TradingView. Read more in the Terms of Use.