OPEN-SOURCE SCRIPT
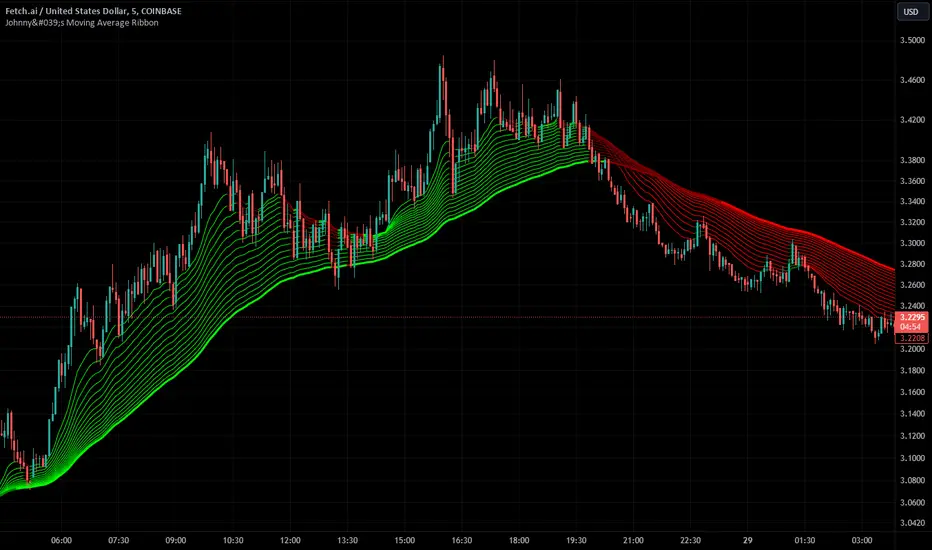
Johnny's Moving Average Ribbon

Props to Madrid for creating the original script: Madrid Moving Average Ribbon.
All I did was upgrade it to pinescript v5 and added a few changes to the script.
Features and Functionality
Moving Average Types: The indicator offers a choice between exponential moving averages (EMAs) and simple moving averages (SMAs), allowing users to select the type that best fits their trading strategy.
Dynamic Color Coding: Each moving average line within the ribbon changes color based on its direction and position relative to a reference moving average, providing visual cues for market sentiment and trend strength.
Usage and Application
Trend Identification: Traders can quickly ascertain the market's direction at a glance by observing the predominant color of the ribbon and its orientation.
Trade Entry and Exit Points: The color transitions within the ribbon can signal potential entry or exit points, with changes from green to lime or red to maroon indicating shifts in market momentum.
Customization: Users have the flexibility to toggle between exponential and simple moving averages, allowing for a tailored analytical approach that aligns with their individual trading preferences.
Technical Specifications
The ribbon consists of multiple moving averages calculated over different periods, typically ranging from shorter to longer-term intervals to capture various aspects of market behavior.
The color dynamics are determined by comparing each moving average to a reference point, often a longer-term moving average within the ribbon, to assess the relative trend strength and direction.
All I did was upgrade it to pinescript v5 and added a few changes to the script.
Features and Functionality
Moving Average Types: The indicator offers a choice between exponential moving averages (EMAs) and simple moving averages (SMAs), allowing users to select the type that best fits their trading strategy.
Dynamic Color Coding: Each moving average line within the ribbon changes color based on its direction and position relative to a reference moving average, providing visual cues for market sentiment and trend strength.
- Lime Green: Indicates an uptrend and potential long positions, shown when a moving average is rising and above the longer-term reference MA.
- Maroon: Suggests caution for long positions or potential short reentry points, displayed when a moving average is rising but below the reference MA.
- Ruby Red: Represents a downtrend, suitable for short positions, shown when a moving average is falling and below the reference MA.
- Green: Signals potential reentry points for downtrends or warnings for uptrend reversals, displayed when a moving average is falling but above the reference MA.
Usage and Application
Trend Identification: Traders can quickly ascertain the market's direction at a glance by observing the predominant color of the ribbon and its orientation.
Trade Entry and Exit Points: The color transitions within the ribbon can signal potential entry or exit points, with changes from green to lime or red to maroon indicating shifts in market momentum.
Customization: Users have the flexibility to toggle between exponential and simple moving averages, allowing for a tailored analytical approach that aligns with their individual trading preferences.
Technical Specifications
The ribbon consists of multiple moving averages calculated over different periods, typically ranging from shorter to longer-term intervals to capture various aspects of market behavior.
The color dynamics are determined by comparing each moving average to a reference point, often a longer-term moving average within the ribbon, to assess the relative trend strength and direction.
Open-source script
In true TradingView spirit, the author of this script has published it open-source, so traders can understand and verify it. Cheers to the author! You may use it for free, but reuse of this code in publication is governed by House rules. You can favorite it to use it on a chart.
Disclaimer
The information and publications are not meant to be, and do not constitute, financial, investment, trading, or other types of advice or recommendations supplied or endorsed by TradingView. Read more in the Terms of Use.