OPEN-SOURCE SCRIPT
Linear Average Price
Updated
What is "Linear Average Price"?
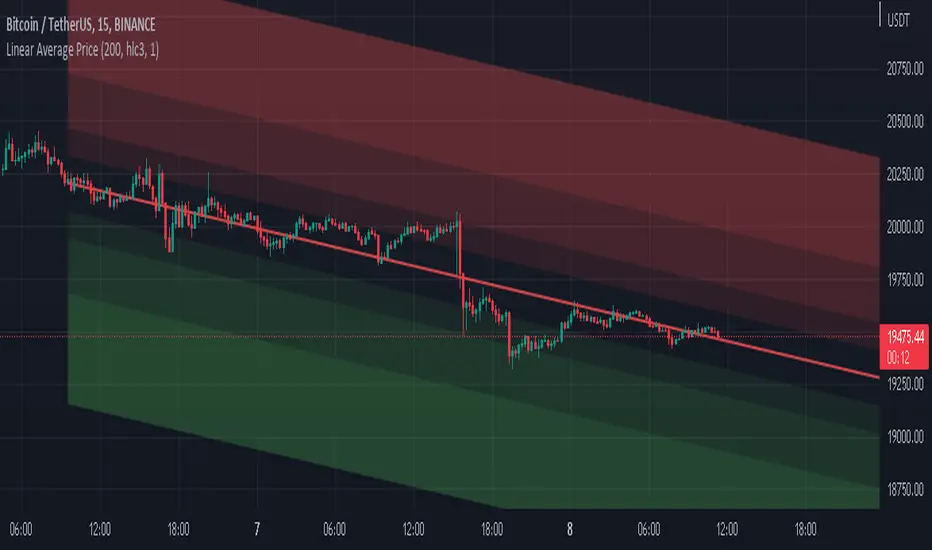
"Linear Average Price" is both a trend and an overbought oversold indicator .
What it does?
it creates a trendline and trading zones.
How it does it?
To create the trend line, it averages the difference between each data and chooses it as the slope of the line it creates. then it positions this line so that it passes right through the middle of the data at hand. It uses standard deviation to create trading zones.
How to use it?
It can be used both to have an idea about the trend direction and to determine buy-sell zones. You can choose how many candles the indicator will calculate from the "lenght" section. The "range" part is the coefficient of the standard deviation and can be used to expand or collapse zones.
Release Notes
source added.Now you can use this indicator with other indicators. All you have to do is to select an indicator from the "source" section, and then if the indicator you selected is in the lower section, then take the "linear average price" indicator into the lower section.
rsi with linear average price:
macd with linear average price:
default value is set to 200.
Open-source script
In true TradingView spirit, the author of this script has published it open-source, so traders can understand and verify it. Cheers to the author! You may use it for free, but reuse of this code in publication is governed by House rules. You can favorite it to use it on a chart.
Disclaimer
The information and publications are not meant to be, and do not constitute, financial, investment, trading, or other types of advice or recommendations supplied or endorsed by TradingView. Read more in the Terms of Use.