OPEN-SOURCE SCRIPT
Bollinger Clouds
Updated

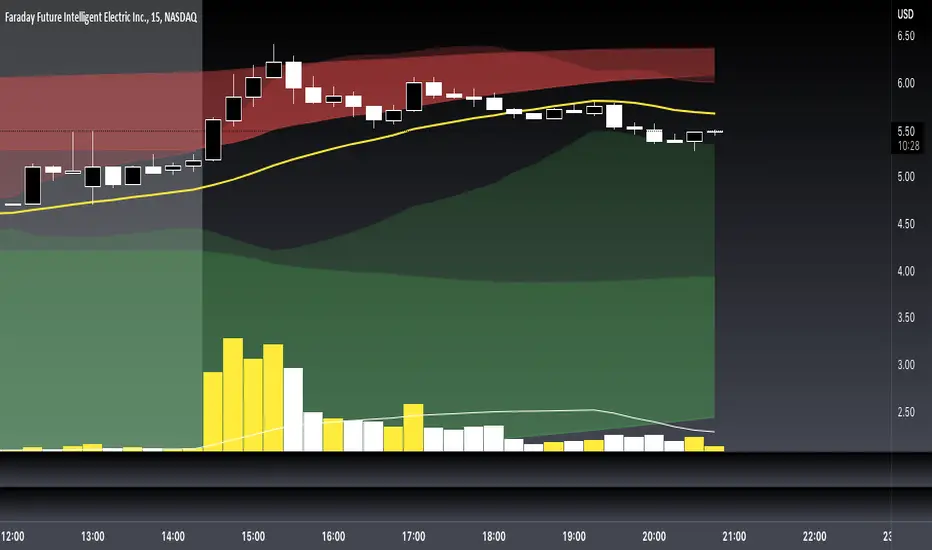
This indicator plots Bollinger Bands for your current timeframe (e.g 5 minutes) and also plots the Bollinger Bands for a higher timeframe (15 minutes for 5 minute timeframe). Then the gaps between the current and higher timeframe upper and lower bands is filled to create clouds which can be used as entry zones. Like Bollinger Bands, this indicator shouldn't be solely used for entries, use it in conjunction with other indicators.
Bollinger Band Timeframes
Current / Higher
1 minute / 5 minutes
3 minutes / 10 minutes
5 minutes / 15 minutes
10 minutes / 30 minutes
15 minutes / 1 hour
30 minutes / 2 hours
45 minutes / 1.5 hours
1 hour / 4 hours
2 hours / 8 hours
2.5 hours / 10 hours
4 hours / 1 Day
1 Day / 3 Days
3 Days / 9 Days
5 Days / 2 Weeks
1 Week / 1 Month
Release Notes
Changes - Changed lengthLonger to an integer instead of and input integer
- Updated Comment "Longer Timeframe" > "Higher Timeframe"
- Updated chart as original had additional indicators
Release Notes
- Changed some variable names- Increased transparency on clouds
New Features
- Added a higher timeframe cloud (see new timeframes below)
Current / Higher / Highest
1 minute / 5 minutes / 15 minutes
3 minutes / 10 minutes / 40 Minutes
5 minutes / 15 minutes / 1 hour
10 minutes / 30 minutes / 2 hours
15 minutes / 1 hour / 3 hours
30 minutes / 2 hours / 6 hours
45 minutes / 3 hours / 9 hours
1 hour / 4 hours / 16 hours
2 hours / 8 hours / 32 hours
2.5 hours / 10 hours / 40 hours
4 hours / 1 day / 3 days
1 day / 3 days / 9 days
3 days / 9 days / 27 days
5 ways / 2 weeks / 8 weeks
1 Week / 1 Month
Release Notes
- Used less cluttered chartOpen-source script
In true TradingView spirit, the author of this script has published it open-source, so traders can understand and verify it. Cheers to the author! You may use it for free, but reuse of this code in publication is governed by House rules. You can favorite it to use it on a chart.
Disclaimer
The information and publications are not meant to be, and do not constitute, financial, investment, trading, or other types of advice or recommendations supplied or endorsed by TradingView. Read more in the Terms of Use.