OPEN-SOURCE SCRIPT
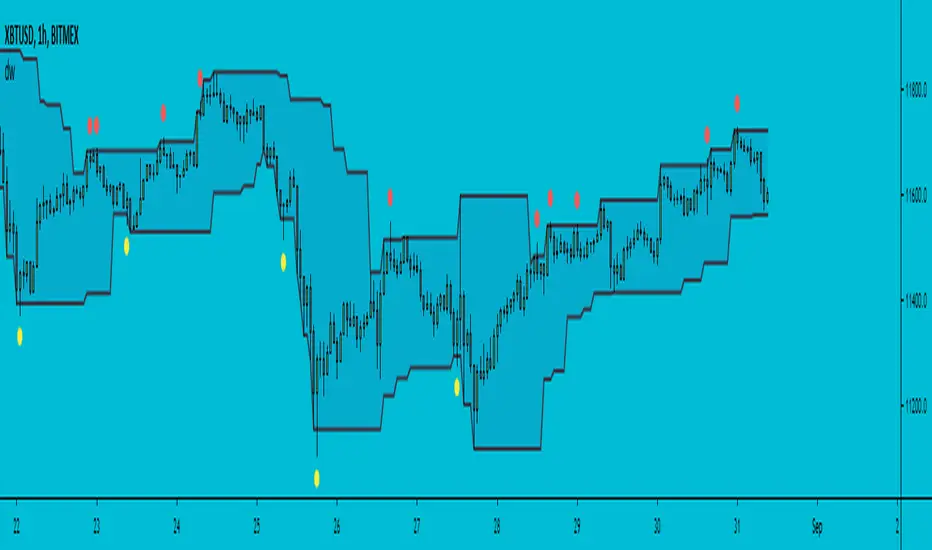
Donchian Wicks
Note: This script does not perform well on its own and is meant to inspire other coders, just sharing it because why not :)
The idea is simple, highest only gets calculated for green candles, lowest only gets calculated for red candles. a yellow dot gets created when a candle gets below lowest line and closes bullish, vise versa for red dots.
Hope someone can use it.
The idea is simple, highest only gets calculated for green candles, lowest only gets calculated for red candles. a yellow dot gets created when a candle gets below lowest line and closes bullish, vise versa for red dots.
Hope someone can use it.
Open-source script
In true TradingView spirit, the author of this script has published it open-source, so traders can understand and verify it. Cheers to the author! You may use it for free, but reuse of this code in publication is governed by House rules. You can favorite it to use it on a chart.
Disclaimer
The information and publications are not meant to be, and do not constitute, financial, investment, trading, or other types of advice or recommendations supplied or endorsed by TradingView. Read more in the Terms of Use.