PROTECTED SOURCE SCRIPT
Day Trade Indicator [by KN Lo]
Updated
Design for LONG and Day Trade only
=============================
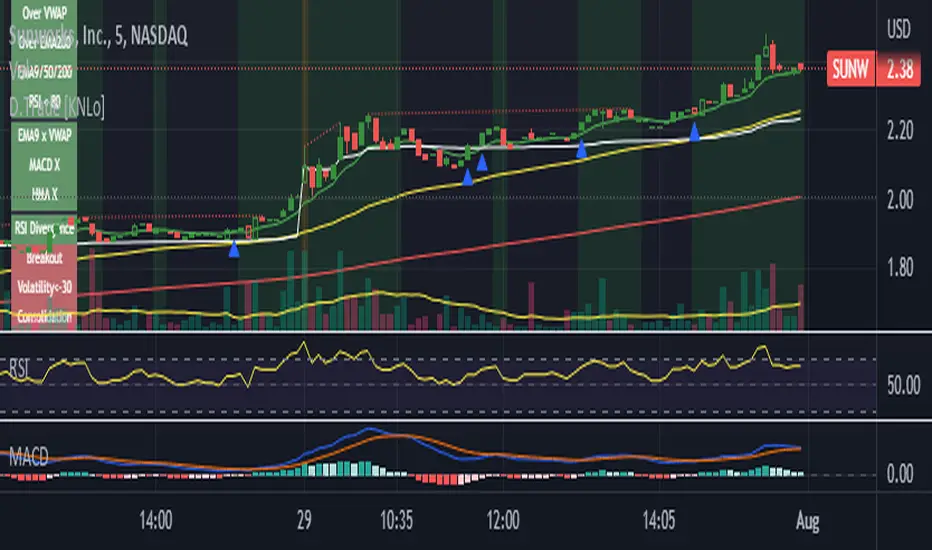
features (this indicator is able to):
- show EMA 9, 50, 200 & VWAP
- show Candle Pattern (e.g. Engulfing, Shooting Star)
- show HMA fast(10) / slow(50) lines
- show Breakout Signal (Blue triangle)
- show RSI Divergence
- find Volitility Decreasing
- find Consolidation stage
- change Background color (green) when positive figures
- show indicator table
=============================
indicator table:
[MUST]
- Price over VWAP
- Price over EMA200
- EMA9 > EMA50 > EMA200
- RSI < 80
[nice to have]
- EMA9 > VWAP
- MACD fast > slow
- HMA fast > slow
[Other status]
- RSI Divergence (compare with previous higher high)
- Breakout Signal when the price is higher than previous high
- Volitility: the difference between previous high (9 periods) and previous low (9 periods), average by SMA, if lower than -30, show in green color.
- Consolidation: consider previous 7 periods to find consolidation stage.
=============================
features (this indicator is able to):
- show EMA 9, 50, 200 & VWAP
- show Candle Pattern (e.g. Engulfing, Shooting Star)
- show HMA fast(10) / slow(50) lines
- show Breakout Signal (Blue triangle)
- show RSI Divergence
- find Volitility Decreasing
- find Consolidation stage
- change Background color (green) when positive figures
- show indicator table
=============================
indicator table:
[MUST]
- Price over VWAP
- Price over EMA200
- EMA9 > EMA50 > EMA200
- RSI < 80
[nice to have]
- EMA9 > VWAP
- MACD fast > slow
- HMA fast > slow
[Other status]
- RSI Divergence (compare with previous higher high)
- Breakout Signal when the price is higher than previous high
- Volitility: the difference between previous high (9 periods) and previous low (9 periods), average by SMA, if lower than -30, show in green color.
- Consolidation: consider previous 7 periods to find consolidation stage.
Release Notes
Bug fixedRelease Notes
Add ABCD PatternRelease Notes
Show signal in Yellow color if under vwap, in green if over vwapRelease Notes
Bug FixedRelease Notes
Add a column in the table which shows no. of positive candles vs negative. Release Notes
Bug FixedRelease Notes
provide show / hide table optionDisclaimer
The information and publications are not meant to be, and do not constitute, financial, investment, trading, or other types of advice or recommendations supplied or endorsed by TradingView. Read more in the Terms of Use.