PROTECTED SOURCE SCRIPT
Moving Averages (21, 55, 200) with Parabolic SAR and Support/ Re
Updated

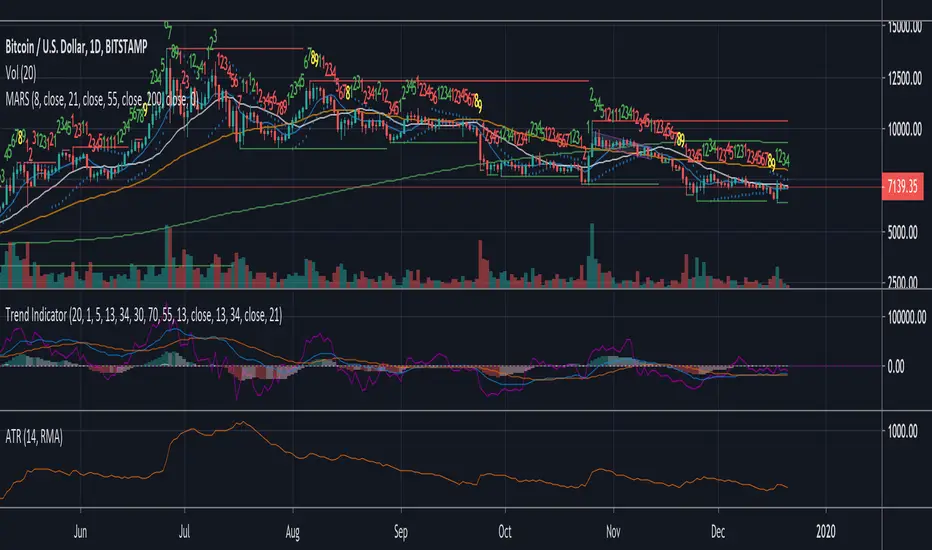
A Simple indicator combining 3 of the most popular simple moving averages; (21,55, 200) with a tweaked Parabolic SAR as well as recent support & resistance points.
Developed to help see key areas of interest on BTCUSD quickly without needing to draw many manual trendlines in order to trade breakouts or bounces at key levels. But should be useful for any market.
This indicator is best used in combination with oscillators such as the MacD or RSI and also volume.
Developed to help see key areas of interest on
This indicator is best used in combination with oscillators such as the MacD or RSI and also volume.
Release Notes
In this update a fibonacci inspired sequential was added.The increasing numbers above the candle indicates how long the market has been trending for.
The yellow fibonacci numbers signal a possible turning points as the trend may be getting exhausted. For best results combine this with volume and candlestick patterns that signal reversals. (e.g. a hammer candle on an 8, or 13 for a bottom and shooting star on an 8 or 13 to mark the top)
Release Notes
- Added shorter 8 period MA in blue - Updated the sequential to use the Standard TD sequential rules with perfected 8's & 9's being highlighted yellow.
Release Notes
Updated the indicator title so it's easier to find. Also removed a bunch of unnecessary inputs so clean up the settings tab.Disclaimer
The information and publications are not meant to be, and do not constitute, financial, investment, trading, or other types of advice or recommendations supplied or endorsed by TradingView. Read more in the Terms of Use.