PROTECTED SOURCE SCRIPT
EMA ATR Engulfing Candles
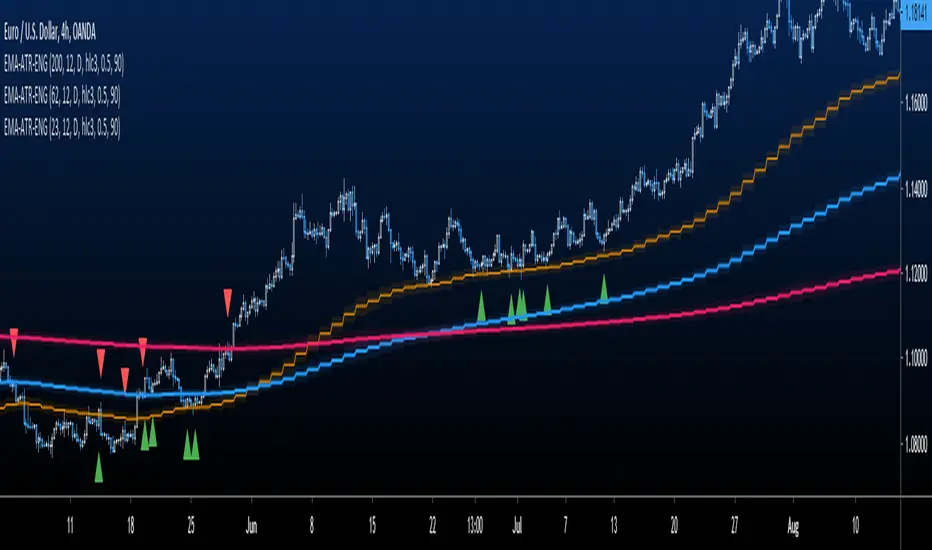
This is good old EMA (Exponential Moving Average) with a twist. The EMA line is surrounded by ATR on either side giving you visibility on how market breadth is working out.
The icing on this cake is in the form of engulfing candle indications. Whenever the engulfing candle happens to be inside the size (that's upper and low ATR area limits around EMA) and the engulfing candle has closed in the appropriate direction, the signal triangle comes up. To understand this...
The settings enable you to set the following
I have been using this in different timeframes to generate signals and found that it generates pretty good alpha.
Feel free to write to me if you have any ideas that can improve this further or if you wish to discuss how to properly use this.
The icing on this cake is in the form of engulfing candle indications. Whenever the engulfing candle happens to be inside the size (that's upper and low ATR area limits around EMA) and the engulfing candle has closed in the appropriate direction, the signal triangle comes up. To understand this...
- The signal appears only if one of OHLC price point of engulfed and/or engulfing candles are within upper and lower ATR areas around EMA
- When there is a bullish engulfing candle, and the close of the candle is above EMA, a green triangle comes up below the candle
- When there is a bearish engulfing candle and the close of the candle is below EMA, a red triangle comes up above the candle
The settings enable you to set the following
- Length of EMA (default is 200)
- Length of ATR (default is 12)
- Resolution of EMA independent of the chart timeframe (default is Daily)
- Price type (default is hlc3)
- Trade zone width in number of ATRs on either side of EMA (default is 1)
- Other settings to adjust display
I have been using this in different timeframes to generate signals and found that it generates pretty good alpha.
Feel free to write to me if you have any ideas that can improve this further or if you wish to discuss how to properly use this.
Find my daily analysis + trades live & FREE 🆓 💰
👉🏼twitter.com/trading_indian
Learn my strategy and get indicators & tools 👉🏼tradingindian.com
👉🏼twitter.com/trading_indian
Learn my strategy and get indicators & tools 👉🏼tradingindian.com
Disclaimer
The information and publications are not meant to be, and do not constitute, financial, investment, trading, or other types of advice or recommendations supplied or endorsed by TradingView. Read more in the Terms of Use.