OPEN-SOURCE SCRIPT
Tilson Bull-Bear-Marker
Updated

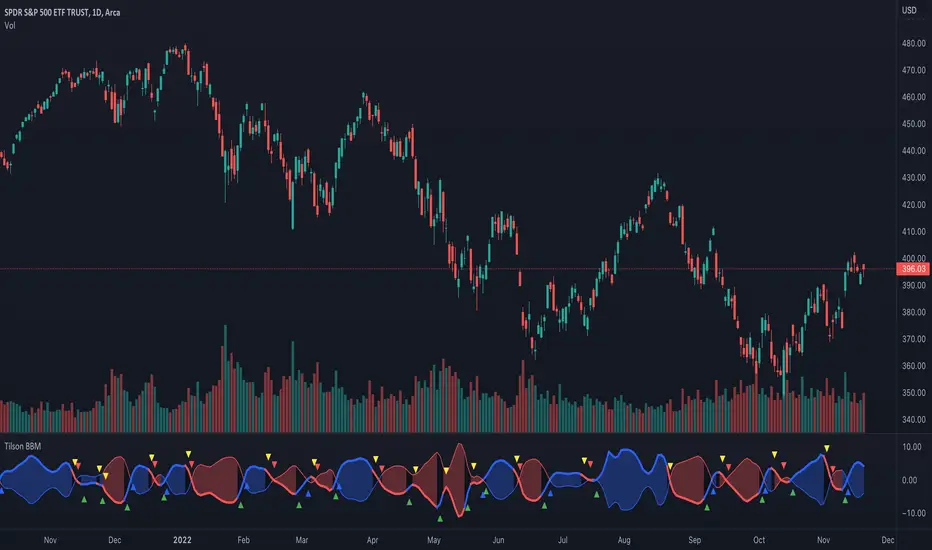
The Tilson Bull-Bear marker is using 2 Tilson moving averages and their divergence to identify bull and bear trends and reversals (potential entry or exit points).
How to use it:
Fast T3 (thick line) above thin line / solid blue fill color = ongoing bull trend
Slow T3 (thin line) above thick line / solid red fill color = ongoing bear trend
Shrinking or expanding divergence between the lines = trend is getting hotter or cooling down
Fast T3 (thick line) changes color from blue to red = potential trend reversal from bullish to bearish
Fast T3 (thick line) changes color from red to blue = potential trend reversal from bearish to bullish
(No financial advise, for testing purposes only)
Release Notes
New Revision- added markers (triangles) and corresponding alertconditions (
Open-source script
In true TradingView spirit, the author of this script has published it open-source, so traders can understand and verify it. Cheers to the author! You may use it for free, but reuse of this code in publication is governed by House rules. You can favorite it to use it on a chart.
Disclaimer
The information and publications are not meant to be, and do not constitute, financial, investment, trading, or other types of advice or recommendations supplied or endorsed by TradingView. Read more in the Terms of Use.