OPEN-SOURCE SCRIPT
AB_Bnf_Selling_5min
The Mathematical Level Reversal Strategy is designed to identify potential reversal points in the market using mathematical levels combined with price action on a 5-minute chart. This strategy is particularly effective for intraday traders who seek to capitalize on precise entry and exit points based on calculated levels rather than traditional indicators like moving averages or Bollinger Bands.
Creators' Mathematical Levels Explanation
Mathematical levels are predetermined price points calculated based on various factors such as previous high/low points, Fibonacci retracements, or other arithmetic calculations. These levels are used to anticipate areas where the price might reverse or experience significant support or resistance.
higher threshold: A predefined level where the price is expected to experience resistance, leading to a potential reversal downward.
Lower Threshold: A predefined level where the price might find support, leading to a potential upward reversal.
In this strategy, we focus on price movements around the upper mathematical level, where prices are likely to reverse downwards.
Strategy Logic
Setup:
The strategy is applied on a 5-minute chart.
Mathematical levels are calculated based on your preferred method, such as Fibonacci levels, pivot points, or custom calculations. For this strategy, let's assume we are using a specific predefined upper level.
Sell Signal Criteria:
A 5-minute candle must cross above the predefined upper mathematical level or close entirely above it (open and close both above the level).
The following candle must break below the low of the candle that crossed the upper level and close below that low. This confirms a bearish reversal.
Once these conditions are met, a sell signal is triggered.
Stop Loss:
The stop loss is placed at the high of the candle that crossed above the upper mathematical level.
This level represents the point where the trade setup would be invalidated.
Take Profit:
Target 1: The first take profit is set at a level that offers a 1:5 risk-to-reward ratio.
Target 2: An alternative take profit level is set at a 1:3 risk-to-reward ratio, providing flexibility based on market conditions.
Trade Management:
Once a trade is initiated, no new trades will be taken until the current trade hits either the stop loss or the first take profit level. This prevents overlapping signals and helps in managing risk effectively.
Originality and Usefulness
This strategy offers a unique approach by using mathematical levels instead of traditional indicators. It provides traders with a clear framework for identifying and executing high-probability reversal trades, particularly in intraday markets.
Originality:
The strategy's originality lies in its reliance on mathematical levels combined with a multi-candle confirmation pattern. This approach reduces the chances of false signals and offers a robust method for identifying potential reversals.
Usefulness:
The strategy is particularly useful for traders who prefer a more quantitative approach, relying on calculated price levels rather than indicators. The clear rules for entry, stop loss, and take profit make it easier to execute consistently.
The inclusion of both 1:5 and 1:3 risk-to-reward targets allows for flexibility depending on market conditions, ensuring that traders can adapt to varying levels of volatility.
Chart Signals and Examples
To demonstrate the effectiveness of this strategy, let's look at a few hypothetical examples on a 5-minute chart:
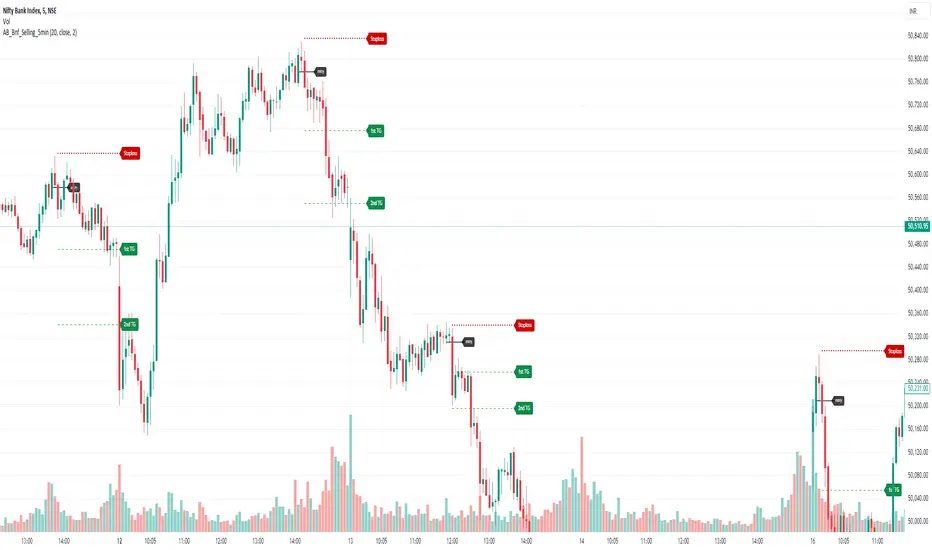
Example 1: Clear Reversal Signal
The price steadily rises and crosses above the predefined upper mathematical level. The next candle breaks below the low of this candle and closes lower, triggering a sell signal.
A red dotted line is drawn at the stop loss level (the high of the candle that crossed the upper level).
Two green dashed lines are drawn to indicate the first and second take profit levels.
Example 2: No Signal Due to Ongoing Trade
After an initial sell signal is triggered, the price fluctuates but does not hit either the stop loss or the first take profit target. During this period, the strategy refrains from issuing any new signals, adhering to the trade management rule.
Example 3: Trade Reaches Target 1
In another scenario, the price moves sharply in favor of the trade after the signal is triggered. The first take profit level is hit, securing a profit. The trade is then considered closed, and the strategy is ready to issue a new signal when conditions are met.
Creators' Mathematical Levels Explanation
Mathematical levels are predetermined price points calculated based on various factors such as previous high/low points, Fibonacci retracements, or other arithmetic calculations. These levels are used to anticipate areas where the price might reverse or experience significant support or resistance.
higher threshold: A predefined level where the price is expected to experience resistance, leading to a potential reversal downward.
Lower Threshold: A predefined level where the price might find support, leading to a potential upward reversal.
In this strategy, we focus on price movements around the upper mathematical level, where prices are likely to reverse downwards.
Strategy Logic
Setup:
The strategy is applied on a 5-minute chart.
Mathematical levels are calculated based on your preferred method, such as Fibonacci levels, pivot points, or custom calculations. For this strategy, let's assume we are using a specific predefined upper level.
Sell Signal Criteria:
A 5-minute candle must cross above the predefined upper mathematical level or close entirely above it (open and close both above the level).
The following candle must break below the low of the candle that crossed the upper level and close below that low. This confirms a bearish reversal.
Once these conditions are met, a sell signal is triggered.
Stop Loss:
The stop loss is placed at the high of the candle that crossed above the upper mathematical level.
This level represents the point where the trade setup would be invalidated.
Take Profit:
Target 1: The first take profit is set at a level that offers a 1:5 risk-to-reward ratio.
Target 2: An alternative take profit level is set at a 1:3 risk-to-reward ratio, providing flexibility based on market conditions.
Trade Management:
Once a trade is initiated, no new trades will be taken until the current trade hits either the stop loss or the first take profit level. This prevents overlapping signals and helps in managing risk effectively.
Originality and Usefulness
This strategy offers a unique approach by using mathematical levels instead of traditional indicators. It provides traders with a clear framework for identifying and executing high-probability reversal trades, particularly in intraday markets.
Originality:
The strategy's originality lies in its reliance on mathematical levels combined with a multi-candle confirmation pattern. This approach reduces the chances of false signals and offers a robust method for identifying potential reversals.
Usefulness:
The strategy is particularly useful for traders who prefer a more quantitative approach, relying on calculated price levels rather than indicators. The clear rules for entry, stop loss, and take profit make it easier to execute consistently.
The inclusion of both 1:5 and 1:3 risk-to-reward targets allows for flexibility depending on market conditions, ensuring that traders can adapt to varying levels of volatility.
Chart Signals and Examples
To demonstrate the effectiveness of this strategy, let's look at a few hypothetical examples on a 5-minute chart:
Example 1: Clear Reversal Signal
The price steadily rises and crosses above the predefined upper mathematical level. The next candle breaks below the low of this candle and closes lower, triggering a sell signal.
A red dotted line is drawn at the stop loss level (the high of the candle that crossed the upper level).
Two green dashed lines are drawn to indicate the first and second take profit levels.
Example 2: No Signal Due to Ongoing Trade
After an initial sell signal is triggered, the price fluctuates but does not hit either the stop loss or the first take profit target. During this period, the strategy refrains from issuing any new signals, adhering to the trade management rule.
Example 3: Trade Reaches Target 1
In another scenario, the price moves sharply in favor of the trade after the signal is triggered. The first take profit level is hit, securing a profit. The trade is then considered closed, and the strategy is ready to issue a new signal when conditions are met.
Open-source script
In true TradingView spirit, the author of this script has published it open-source, so traders can understand and verify it. Cheers to the author! You may use it for free, but reuse of this code in publication is governed by House rules. You can favorite it to use it on a chart.
Disclaimer
The information and publications are not meant to be, and do not constitute, financial, investment, trading, or other types of advice or recommendations supplied or endorsed by TradingView. Read more in the Terms of Use.