OPEN-SOURCE SCRIPT
Correlated ATR Bands | Adulari
Updated

How do I use it?
Features:
How does it work?
1 — ATR value is calculated, then the correlation between the source and ATR is calculated.
2 — Final value is calculated using the following formula:
correlation * atr + (1 - correlation) * nz(atr[1], atr)
3 — Moving average is calculated with the following formula:
ta.hma((1-(correlation/100*(1+weight/10)))*(ta.sma(source+value, smoothing)+ta.sma(source-value,smoothing))/2,flength)
4 — Bands calculation using multipliers.
- Never use this indicator as standalone trading signal, it should be used as confluence.
- It is highly recommended to use this indicator on the 15m timeframe and above, try experimenting with the inverse feature and multipliers as well.
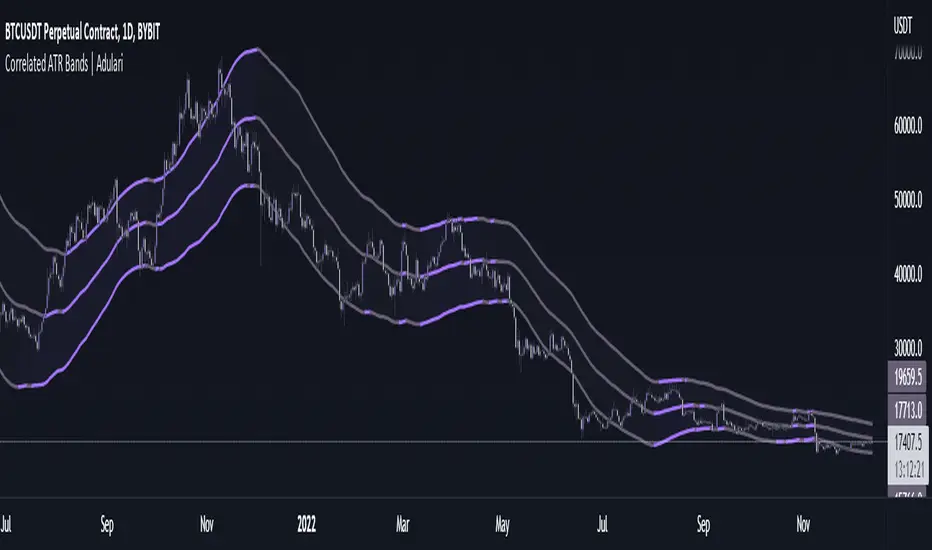
- When the price is above the moving average this shows the bullish trend is strong.
- When the price is below the moving average this shows the bearish trend is strong.
- When the moving average is purple, the trend is bullish , when it is gray, the trend is bearish.
- When price is above the upper band this may indicate a bearish reversal.
- When price is below the lower band this may indicate a bullish reversal.
Features:
- Purple line for bullish trend and gray line for bearish trend.
- Custom formula combining an ATR and Hull MA to clearly indicate trend strength and direction.
- Unique approach to moving averages and bands by taking the average of 2 types of MA's combined with custom ATR's, then multiplying these by correlation factors.
- Bands to indicate possible trend reversals when price crosses them.
How does it work?
1 — ATR value is calculated, then the correlation between the source and ATR is calculated.
2 — Final value is calculated using the following formula:
correlation * atr + (1 - correlation) * nz(atr[1], atr)
3 — Moving average is calculated with the following formula:
ta.hma((1-(correlation/100*(1+weight/10)))*(ta.sma(source+value, smoothing)+ta.sma(source-value,smoothing))/2,flength)
4 — Bands calculation using multipliers.
Release Notes
- Fixed time adaptive calculations for higher timeframes.
Open-source script
In true TradingView spirit, the author of this script has published it open-source, so traders can understand and verify it. Cheers to the author! You may use it for free, but reuse of this code in publication is governed by House rules. You can favorite it to use it on a chart.
Disclaimer
The information and publications are not meant to be, and do not constitute, financial, investment, trading, or other types of advice or recommendations supplied or endorsed by TradingView. Read more in the Terms of Use.