OPEN-SOURCE SCRIPT
Swing Harmony Indicator
Updated
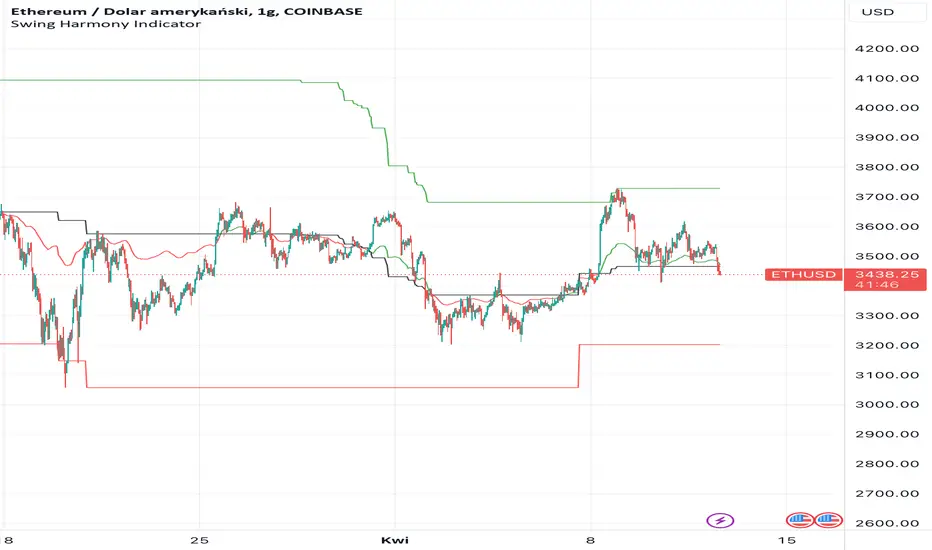
This indicator is called "Swing Harmony Indicator" and it calculates the average of the highest high and lowest low prices over a certain period, along with a simple moving average of the closing prices. It then plots these values on the chart, with the color of the average line dynamically changing based on whether the second average is less than or greater than the first average.
Release Notes
This indicator is called "swing harmony indicator" and it calculates the average of the highest high and lowest low prices over a certain period, along with a simple moving average of the closing prices. It then plots these values on the chart, with the color of the average line dynamically changing based on whether the second average is less than or greater than the first average.Open-source script
In true TradingView spirit, the author of this script has published it open-source, so traders can understand and verify it. Cheers to the author! You may use it for free, but reuse of this code in publication is governed by House rules. You can favorite it to use it on a chart.
Disclaimer
The information and publications are not meant to be, and do not constitute, financial, investment, trading, or other types of advice or recommendations supplied or endorsed by TradingView. Read more in the Terms of Use.