OPEN-SOURCE SCRIPT
Gross and Net LTF Volume + Trailing Percentile Sessions CVOL
Updated

Hi Traders !
Gross volume, net lower time frame (LTF) volume and trailing session percentile Cumulative session volume:
The code calculates and plots the following volume indicators:
The above indicators may be plotted exclusively or exclusively.
Why is Volume important:
Volume is the number of shares or contracts traded (of a financial asset) during a given time period (timeframe). It is a crucial indicator in technical analysis and quantitative trading, as volume helps in identifying
For example, suppose we want to identify positive price confirmation and positive trend strength, in this case we may use the CVOL (with trailing percentile).

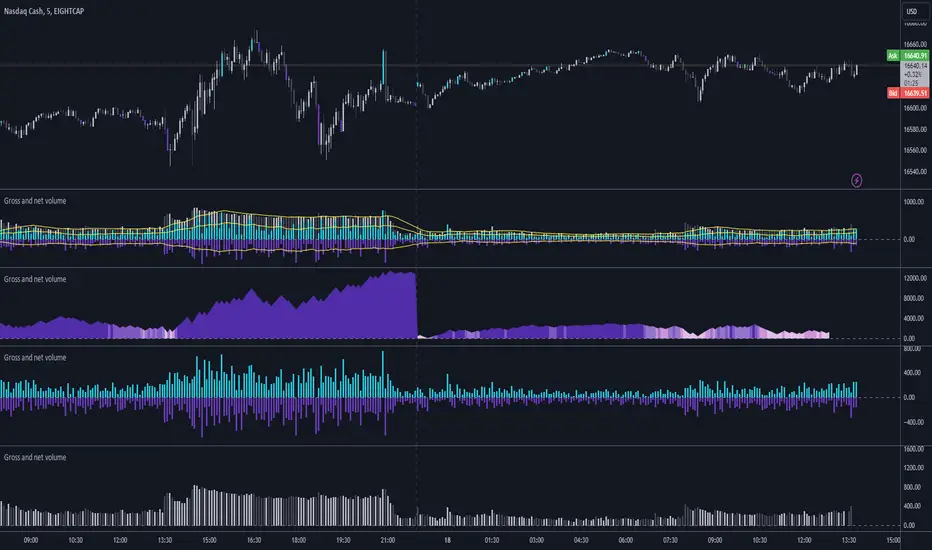
The above image showcases price expansion conditional on high positive volume (increasing CVOL), The price expansion also exhibits Volume confluences (the colored bars).
Also note how the percentile color does not change, this means that the new volume bars are > than the highest percentile (80%) of volume values from the beginning of the session.
Gross volume, net lower time frame (LTF) volume and trailing session percentile Cumulative session volume:
The code calculates and plots the following volume indicators:
- Volume (Gross Volume): The total volume for the current bar.
- Net lower time frame volume: The difference between the buy and sell volumes of the lower time frame.
- Cumulative daily session volume: The cumulative sum of the volume for the current day.
- Percentile Cumulative daily session volume: The percentile of the cumulative daily session volume (calculated on a rolling basis).
The above indicators may be plotted exclusively or exclusively.
Why is Volume important:
Volume is the number of shares or contracts traded (of a financial asset) during a given time period (timeframe). It is a crucial indicator in technical analysis and quantitative trading, as volume helps in identifying
- Price Confirmation: Volume confirms price movements by indicating the level of interest and participation in the market. When prices move significantly, accompanied by strong volume, it suggests that the movement is likely to be sustained. Conversely, if prices move without significant volume, it suggests that the movement may be temporary or lacking conviction.
- Trend Strength: Volume can help identify the strength and direction of a trend. During an uptrend, increasing volume alongside price increases indicates that the upward momentum is gaining traction. Conversely, decreasing volume during an uptrend suggests that the upward momentum may be weakening.
- Reversal Points: Sharp volume spikes in the opposite direction of the prevailing trend can signal a potential reversal point. This is because large volume indicates a significant shift in trader sentiment, suggesting that the trend may be changing direction.
- Liquidity: High volume indicates that a security is liquid, meaning that it can be easily bought and sold without significant price impact. Liquidity is important for traders who want to execute large orders without significantly affecting the market price.
For example, suppose we want to identify positive price confirmation and positive trend strength, in this case we may use the CVOL (with trailing percentile).
The above image showcases price expansion conditional on high positive volume (increasing CVOL), The price expansion also exhibits Volume confluences (the colored bars).
- Positive Confluence: Increase in positive total volume and an increase in positive lower time frame volume in relative and absolute terms.
- Negative Confluence: Increase in negative total volume and an increase in negative lower time frame volume in relative and absolute terms.
Also note how the percentile color does not change, this means that the new volume bars are > than the highest percentile (80%) of volume values from the beginning of the session.
Release Notes
Updates:- UI / settings inputs update
- CVOL label update
Below is a picture of the CVOL wit the updated percentile label plot (with defualt settings. Note "Plot Session Cumulative Volume" has been set to true and "Gross Volume", "LTf Buy Volume" and "LTf Sell Volume" have been set to false).
Open-source script
In true TradingView spirit, the author of this script has published it open-source, so traders can understand and verify it. Cheers to the author! You may use it for free, but reuse of this code in publication is governed by House rules. You can favorite it to use it on a chart.
Disclaimer
The information and publications are not meant to be, and do not constitute, financial, investment, trading, or other types of advice or recommendations supplied or endorsed by TradingView. Read more in the Terms of Use.