PROTECTED SOURCE SCRIPT
100% Daily Gain Levels
Updated
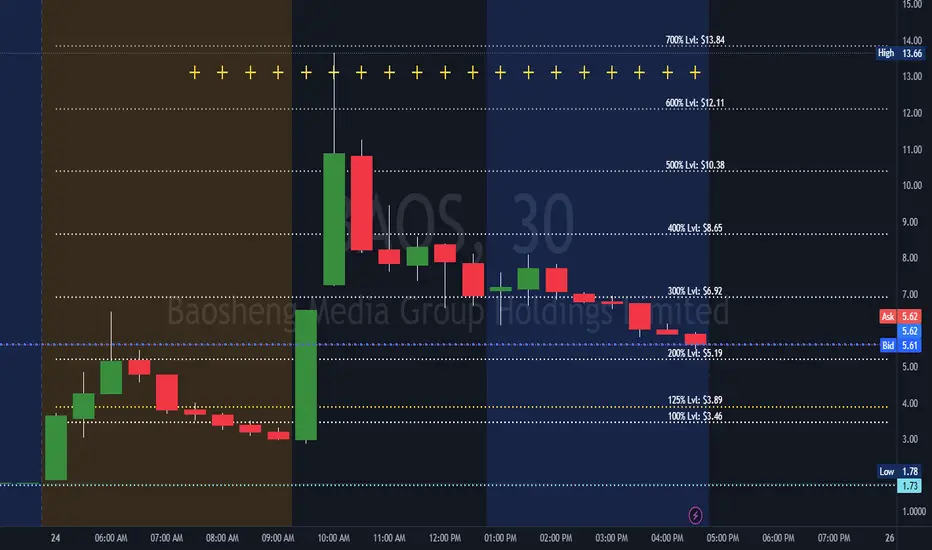
This script takes the previous days closing value and calculates the current 100%, 200%, 300% and 400% levels for that stock.
Using that information it draws a dotted persistent line (with labels on the far right) at those levels. This information can be useful as it can then, at times, act as a support/resistance for momentum stocks. So when a stock runs 100% and holds that level, historically, that stock has a good chance to continue rising. Same when hitting additional "100%" ranges.
The user has the option to deselect the labels and/or lines.
If people find this useful then I can work on adding options that allow users more freedom to adjust how the lines are displayed as well as some enhancements to the display.
Release Notes
Made a minor update to reach up to 1000% and slightly adjusted the different 100% levels. Release Notes
Added an additional yellow dotted line at the 125% level mark as this level can help indicate continuation or add a support area.Disclaimer
The information and publications are not meant to be, and do not constitute, financial, investment, trading, or other types of advice or recommendations supplied or endorsed by TradingView. Read more in the Terms of Use.