PROTECTED SOURCE SCRIPT
FX Multi ZScore Plot
Updated
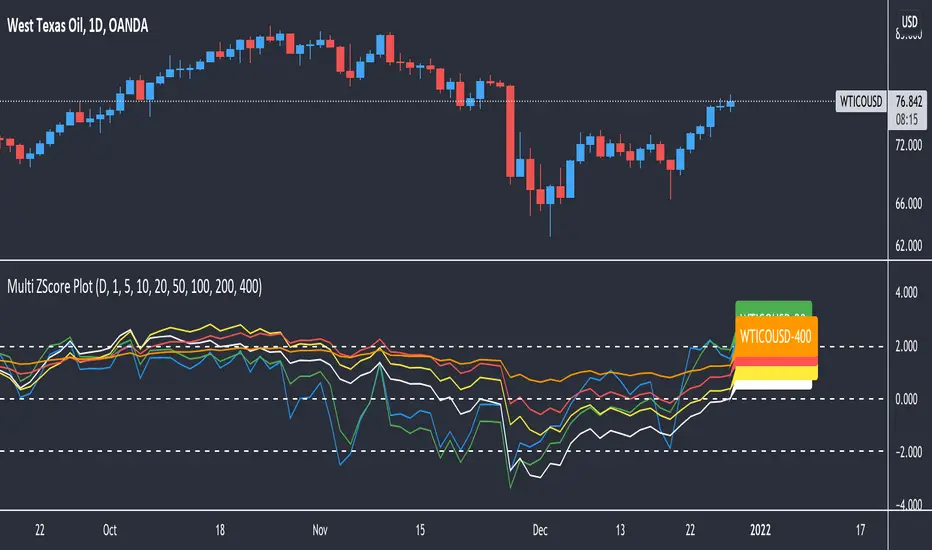
This script was created to help me visualize the location of price within all main 7 averages at once (5,10,20,50,100,200,400)
It uses the Z Score function which basically tells you the distance between Price and a certain average in units of Standard Deviation.
If the indicator has a value above 0, it means price is currently trading above such average. If below 0, price is trading below.
By plotting all averages you have a wider view of where price is trading short, medium and long term.
If you have any questions/suggestions feel free to add a comment below
Release Notes
Update: Just made some changes so that the indicator can be applied to any symbol regardless of market.Disclaimer
The information and publications are not meant to be, and do not constitute, financial, investment, trading, or other types of advice or recommendations supplied or endorsed by TradingView. Read more in the Terms of Use.