INVITE-ONLY SCRIPT
Smoothed Wave Scalper
Updated

This one is a little different.
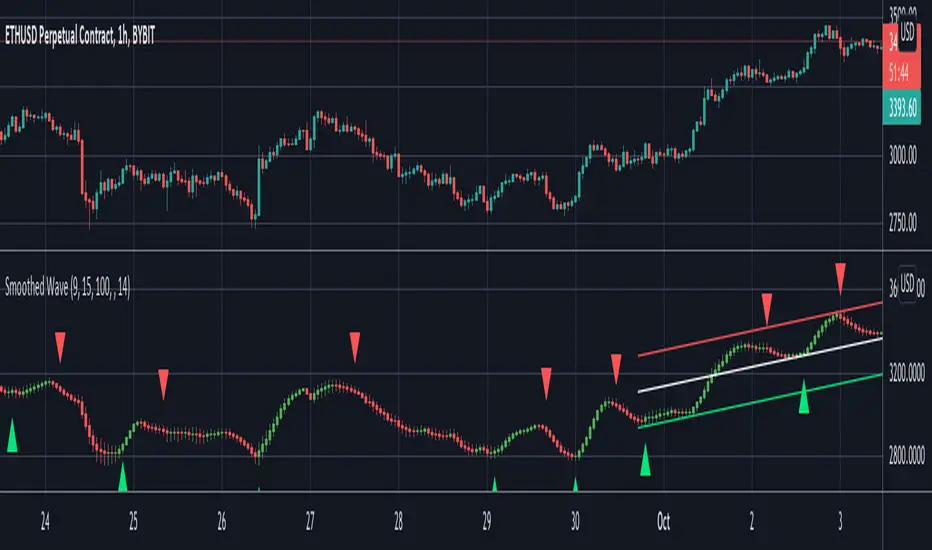
Instead of layering lots of indicators to filter noise, I'm instead using two different kinds of price averaging to smooth the candles and better define the direction. Just select a smoothing value that fits your chart and timeframe. In theory, this should remove a fair bit of noise (although nothing's perfect)
I've managed to determine when the candles change colour, signifying a potential new trend. When the candle colours do change, an alert is fired. It's as simple as that! Wyckoff wave volume analysis is then applied to each alert to validate the move. Further filtering can be achieved using heikin ashi candles if this is your preference.
Alerts are built in for both the candle colour change and the wave filtered signals (long/short). Use long/short for entries and the colour changes for exits.
I'm currently trading with linear regression to help indentify obvious channels and areas of support/resistance. The candles bouncing down off of the upper band can confirm a downward trend, and bouncing off of the lower band can signify an up trend. It's much easier to see with smoothed candles like these and can give you confidence when trading manually. These bands are rendered automatically, but aren't essential to taking a trade.
Release Notes
In addition to the 'Candle color has changed alert', I added more for 'Candle turned green' and 'Candle turned red'Release Notes
- Removing a layer of unnecessary filtering- Adding an alert for the color of the bars changing (likely signalling a new trend)
Invite-only script
Access to this script is restricted to users authorized by the author and usually requires payment. You can add it to your favorites, but you will only be able to use it after requesting permission and obtaining it from its author. Contact colinmck for more information, or follow the author's instructions below.
TradingView does not suggest paying for a script and using it unless you 100% trust its author and understand how the script works. In many cases, you can find a good open-source alternative for free in our Community Scripts.
Want to use this script on a chart?
Warning: please read before requesting access.
Disclaimer
The information and publications are not meant to be, and do not constitute, financial, investment, trading, or other types of advice or recommendations supplied or endorsed by TradingView. Read more in the Terms of Use.