INVITE-ONLY SCRIPT
Donchian Channels with Auto Fibonacci Retracement
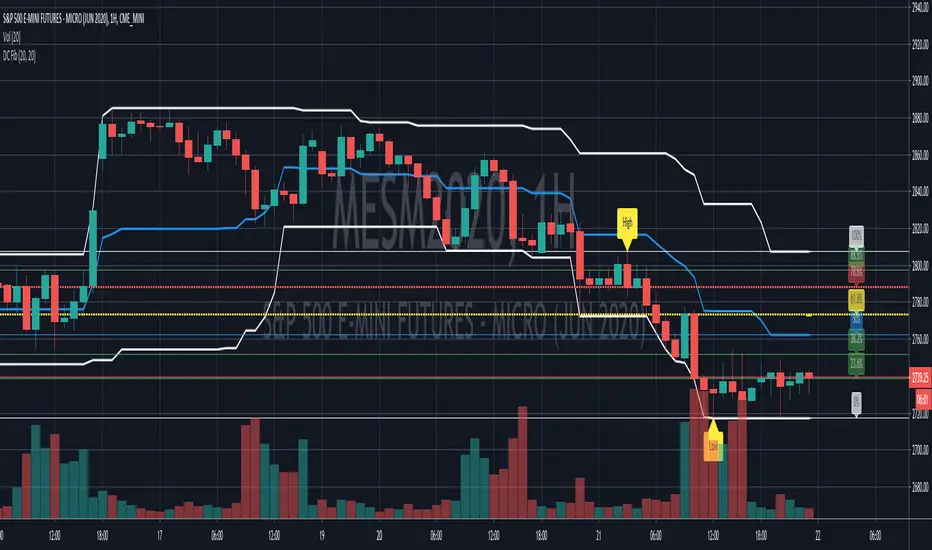
Richard Donchian created Donchian Channels, which is a type of moving average indicator and a look-alike of other support and resistance trading indicators like Bollinger Bands.
Donchian Channels has a simple plotting of highest high and lowest low of the last “n” periods.
The “n” periods is based on the trader’s choice, who can select the period according to their requirements ranging from a day, hour and minutes etc.
Traders use Donchian Channels to understand the support and resistance levels.
Donchian Channels is a popular indicator for determining volatility in market prices.
The channels are wider when there are heavy price fluctuations and narrow when prices are relatively flat.
Generally, investors use 20-periods with the Donchian Channels as the default trading setting, but this value can be tweaked based on your trading style.
Donchian channels are mainly used to identify the breakout of a stock or any traded entity enabling traders to take either long or short positions.
Traders can take a long position, if the stock is trading higher than the Donchian channels “n” period and book their profits/short the stock if it is trading below the DC channels “n” period.
The middle band is the average of the upper and lower bands.
The middle band in Donchian channels could also be used as a breakout indicator.
If the stock rises above the middle band of the Donchian channels, then you can open a long position.
On the contrary, if the stock is trading below the middle band of the Donchian channel, then a trader can open a short position.
Combining Donchian Channel trading strategies with other trading strategies might decrease the false entry/exit signals and give a clearer picture of trading opportunities.
If you start to trade a choppy market on an intraday basis, you will be overloaded with false signals.
So, what I noticed is that in order for things to become clearer, we just need to increase the time frame.
Where Donchian Channels Can Fail You
It’s likely not the indicator but more likely our misinterpretation of the signals.
Few areas where the Donchian channel may be tough to read.
Low float stocks are not bound by any indicator, especially Donchian channels.
The challenge with the Donchian channels is that it does not factor in the most recent market volatility.
The indicators provide an equal weighting to all data points.
Therefore when a low float stock picks up and goes on a run, the lower bounds not capture the price movements quickly enough, thus risking giving back more profits than necessary.
Follow us
Twitter twitter.com/darksidetrader
YouTube youtube.com/channel/UCAR8aMbticG9ePJrxeZ8mjw
Join Chat Room discord.gg/N4HSqJN96X
Website tradersofwallst.com
Live
9:00 AM EST to 2:30 PM EST
Twitter twitter.com/darksidetrader
YouTube youtube.com/channel/UCAR8aMbticG9ePJrxeZ8mjw
Join Chat Room discord.gg/N4HSqJN96X
Website tradersofwallst.com
Live
9:00 AM EST to 2:30 PM EST
Invite-only script
Access to this script is restricted to users authorized by the author and usually requires payment. You can add it to your favorites, but you will only be able to use it after requesting permission and obtaining it from its author. Contact DarkSideTrader for more information, or follow the author's instructions below.
Please note that this is a private, invite-only script that was not analyzed by script moderators. Its compliance to House Rules is undetermined. TradingView does not suggest paying for a script and using it unless you 100% trust its author and understand how the script works. In many cases, you can find a good open-source alternative for free in our Community Scripts.
Want to use this script on a chart?
Warning: please read before requesting access.
Disclaimer
The information and publications are not meant to be, and do not constitute, financial, investment, trading, or other types of advice or recommendations supplied or endorsed by TradingView. Read more in the Terms of Use.