OPEN-SOURCE SCRIPT
On Balance Volume Disparity Indicator
Updated
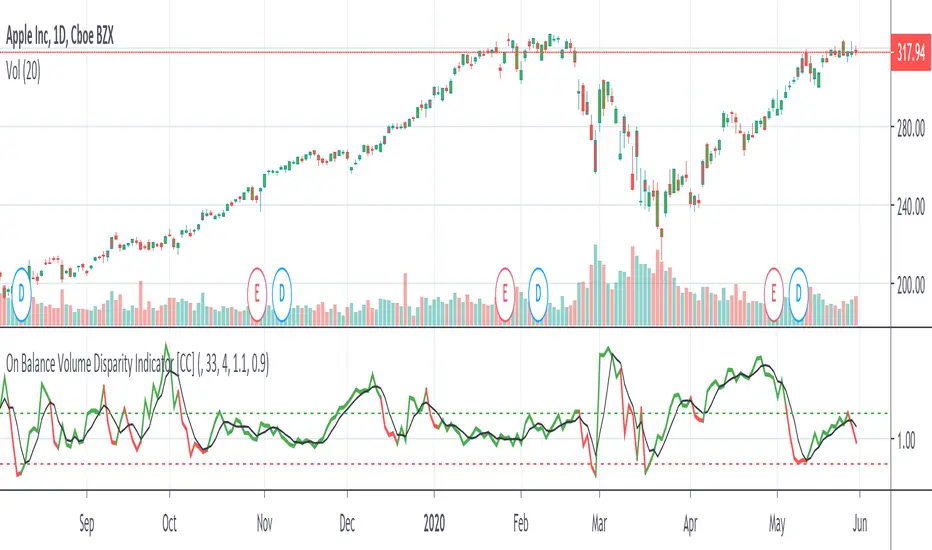
The On Balance Volume Disparity Indicator was created by Phillip C. Holt (Stocks & Commodities V. 14:6 (265-269)). This converts the classic OBV indicator into Bollinger Bands and calculates the percentage of where the value lies within the Bollinger Bands. Buy when the obvdi rises above its signal line and sell when it falls below the signal line.
This was a special request so let me know what other indicators you would like me to write scripts for!
This was a special request so let me know what other indicators you would like me to write scripts for!
Release Notes
I changed the chartsRelease Notes
changed the signal lengthRelease Notes
changed to make it more understandableRelease Notes
Allowed someone to change the top and bottom guide and changed the signals to buy or sell when obvdi goes above the top or falls below the bottomRelease Notes
changed the signal to sma and default length to 4Release Notes
Finalized the buy and sell signals Release Notes
fixed small typoRelease Notes
changed to match my other indicatorsRelease Notes
fixed issue with default resolutionI created the largest stock indicator library:
github.com/ooples/
Custom Indicator Requests:
forms.gle/ouMffZR3dQ8bSJQG7
Tips are appreciated:
paypal.me/cheatcountry
patreon.com/cheatcountry
github.com/ooples/
Custom Indicator Requests:
forms.gle/ouMffZR3dQ8bSJQG7
Tips are appreciated:
paypal.me/cheatcountry
patreon.com/cheatcountry
Open-source script
In true TradingView spirit, the author of this script has published it open-source, so traders can understand and verify it. Cheers to the author! You may use it for free, but reuse of this code in publication is governed by House rules. You can favorite it to use it on a chart.
Disclaimer
The information and publications are not meant to be, and do not constitute, financial, investment, trading, or other types of advice or recommendations supplied or endorsed by TradingView. Read more in the Terms of Use.