OPEN-SOURCE SCRIPT
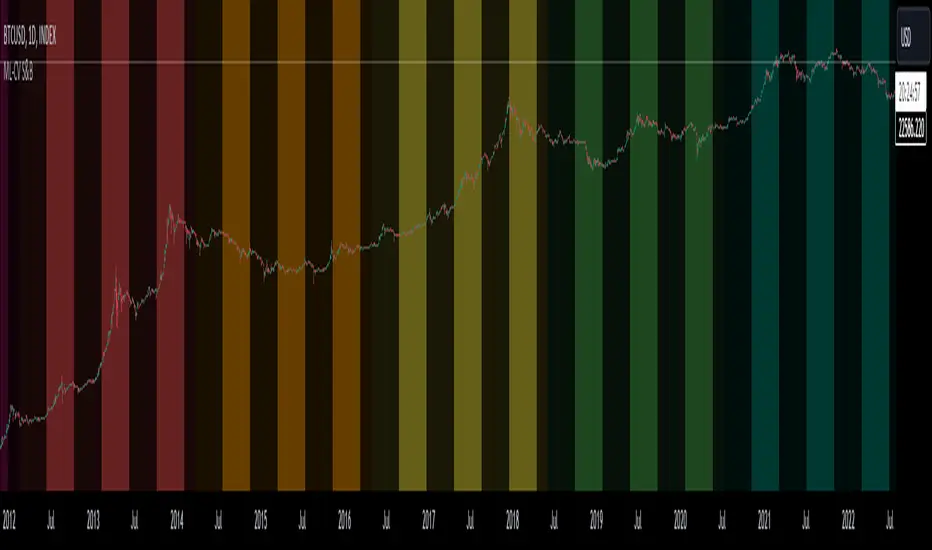
Machine Learning Cross-Validation Split & Batch Highlighter

This indicator is designed for traders and analysts who employ Machine Learning (ML) techniques for cross-validation in financial markets.
The script visually segments a selected range of historical price data into splits and batches, helping in the assessment of model performance over different market conditions.
User https://www.tradingview.com/x/XQ4CoxZy/
Theory
In ML, cross-validation is a technique to assess the generalizability of a model, typically by partitioning the data into a set of "folds" or "splits." Each split acts as a validation set, while the others form the training set. This script takes a unique approach by considering the sequential nature of financial time series data, where random shuffling of data (as in traditional cross-validation) can disrupt the temporal order, leading to misleading results.
Chronological Integrity of Splits
Even if the order of the splits is shuffled for cross-validation purposes, the data within each split remains in its original chronological sequence. This feature is crucial for time series analysis, as it respects the inherent order-dependency of financial markets. Thus, each split can be considered a microcosm of market behavior, maintaining the integrity of trends, cycles, and patterns that could be disrupted by random sampling.
The script allows users to define the number of splits and the size of each batch within a split. By doing so, it maintains the chronological sequence of the data, ensuring that the validation set is representative of a future time period that the model would predict.
tradingview.com/x/E2tdnFuy/1d
Parameters
Number of Splits: Defines how many segments the selected data range will be divided into. Each split serves as a standalone testing ground for the ML model. (Up to 24)
Batch Size: Determines the number of bars (candles) in each batch within a split. Smaller batches can help pinpoint overfitting at a finer granularity.
Start Index: The bar index from where the historical data range begins. It sets the starting point for data analysis.
End Index: The bar index where the historical data range ends. It marks the cutoff for data to be included in the model assessment.
Usage
To use this script effectively:
1 - Input the Start Index and End Index to define the historical data range you wish to analyze.
2 - Adjust the Number of Splits to create multiple validation sets for cross-validation.
3 - Set the Batch Size to control the granularity of each validation set within the splits.
4 - The script will highlight the background of each batch within the splits using alternating shades, allowing for a clear visual distinction of the data segmentation.
By maintaining the temporal sequence and allowing for adjustable granularity, the "ML Split and Batch Highlighter" aids in creating a robust validation framework for time series forecasting models in finance.
Open-source script
In true TradingView spirit, the author of this script has published it open-source, so traders can understand and verify it. Cheers to the author! You may use it for free, but reuse of this code in publication is governed by House rules. You can favorite it to use it on a chart.
Disclaimer
The information and publications are not meant to be, and do not constitute, financial, investment, trading, or other types of advice or recommendations supplied or endorsed by TradingView. Read more in the Terms of Use.