OPEN-SOURCE SCRIPT
Trendicator
Updated

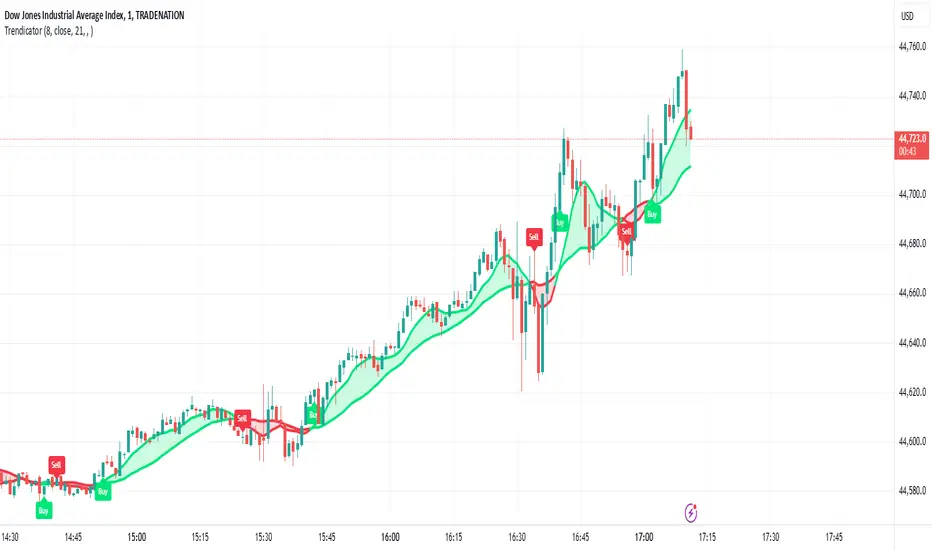
This is a very simple crossover script that looks at a exponential moving average with a standard length set at 20, which may be redefined by the user. A (Uptrend) buy signal is given once a candle closes above the moving average, coloring the exponential average green, and a sell signal is given once a candle closes below the moving average, coloring the exponential average red.
The goal of this indicator is to provide the user with a rather robust idea of whether the market is trending upwards or downwards, more so than providing definitive buy or sell signals. It works with symbols that do not change drastically in shorter time periods (I only trade XAU/USD). XAUUSD
The goal of this indicator is to provide the user with a rather robust idea of whether the market is trending upwards or downwards, more so than providing definitive buy or sell signals. It works with symbols that do not change drastically in shorter time periods (I only trade XAU/USD).
Release Notes
A name change was done, to give an indication as to what is expected from the indicator: Trends!The EMA source can now be selected, with the uptrend signal now only being triggered once the entire candle closes above the selected EMA, and similarly for downtrends - Only triggered when the entire candle closes below the EMA.
Finally, the fill colors have been corrected such as not to overlap.
Release Notes
Description of Changes:- Improved the buy and sell signal logic to ensure only one alert and label per crossover event.
- Added flags to track buy and sell crossovers, preventing repeated signals on consecutive bars.
- Refined the conditions to ensure that buy signals trigger only when both buy conditions are met and similarly for sell signals.
- The script now correctly displays buy and sell labels on the chart and sends notifications only once per respective crossover, enhancing the accuracy and usability of the indicator.
Open-source script
In true TradingView spirit, the author of this script has published it open-source, so traders can understand and verify it. Cheers to the author! You may use it for free, but reuse of this code in publication is governed by House rules. You can favorite it to use it on a chart.
Disclaimer
The information and publications are not meant to be, and do not constitute, financial, investment, trading, or other types of advice or recommendations supplied or endorsed by TradingView. Read more in the Terms of Use.