OPEN-SOURCE SCRIPT
Stochastic RSI Strategy with Inverted Trend Logic
Updated
Overview:
The Stochastic RSI Strategy with Inverted Trend Logic is a custom-built Pine Script indicator that leverages the Stochastic RSI and a 200-period moving average to generate precise buy and sell signals. It is specifically designed for traders looking to capture opportunities during short-term market movements while factoring in broader trend conditions.
Key Components:
200-Period Moving Average:
The 200-period Simple Moving Average (SMA) is used as a trend filter.
If the price is above the 200-period SMA, the trend is considered bullish.
If the price is below the 200-period SMA, the trend is considered bearish.
Inverted Trading Logic:
The trading logic is inverted from traditional strategies:
Long trades are executed only when the market is in a bearish trend (price below the 200-period moving average).
Short trades are executed only when the market is in a bullish trend (price above the 200-period moving average).
This inversion allows traders to take advantage of potential trend reversals by entering positions in the opposite direction of the prevailing trend.
Trading Rules:
Long Trade Conditions (Buy Signal):
The Stochastic RSI K line must be below 5 for 4 consecutive candles (oversold condition).
The price must be below the 200-period SMA (indicating a bearish trend).
Once these conditions are met, the indicator will generate a buy signal on the close of the 4th candle.
Exit Condition: The long position is exited when the Stochastic RSI K line crosses above 50 (neutral level).
Short Trade Conditions (Sell Signal):
The Stochastic RSI K line must be above 95 for 4 consecutive candles (overbought condition).
The price must be above the 200-period SMA (indicating a bullish trend).
Once these conditions are met, the indicator will generate a sell signal on the close of the 4th candle.
Exit Condition: The short position is exited when the Stochastic RSI K line crosses below 50.
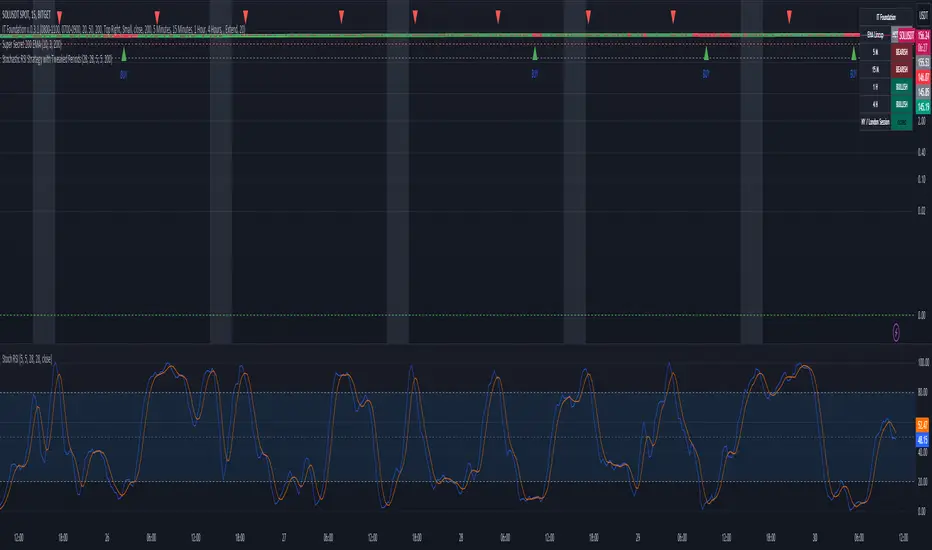
Visual Signals on the Chart:
Buy Signal:
A green triangle below the bar is displayed on the chart when a buy condition is met, indicating a potential long trade opportunity.
The text "BUY" is displayed for further clarity.
Sell Signal:
A red triangle above the bar is displayed on the chart when a sell condition is met, indicating a potential short trade opportunity.
The text "SELL" is displayed for further clarity.
How to Use the Indicator:
Attach the Indicator: Apply the indicator to your desired chart (works on any time frame, but is optimized for short- to medium-term trading).
Monitor Signals: Watch for buy and sell signals on the chart:
Buy Signal: Enter long positions when a green triangle appears below the candle.
Sell Signal: Enter short positions when a red triangle appears above the candle.
Exit Positions: Exit long positions when the Stochastic RSI crosses above the 50 level, and exit short positions when the Stochastic RSI crosses below the 50 level.
Indicator Display:
Stochastic RSI: A visual representation of the Stochastic RSI (K and D lines) is plotted below the price chart, with overbought (100), midpoint (50), and oversold (0) levels clearly marked.
200-period SMA: The 200-period moving average is plotted on the price chart, giving a clear indication of the broader trend direction (orange line).
Key Benefits:
Reversal Opportunities: This strategy allows traders to capture reversal trades by using an inverted logic where longs are taken in bearish conditions and shorts are taken in bullish conditions. This can help capitalize on potential trend exhaustion and reversals.
Clear and Simple Rules: The use of Stochastic RSI and the 200-period moving average ensures the strategy remains simple yet effective, making it easy for traders to follow.
Visual Alerts: The indicator provides clear buy and sell signals, making it easy for traders to spot trading opportunities in real-time without needing to monitor multiple conditions manually.
Limitations and Considerations:
Trend Changes: Since the strategy is designed to work during trend reversals, it might not perform as well during strong, prolonged trends where price continues moving in one direction without significant pullbacks.
Time Frame Suitability: While the indicator works on any time frame, shorter time frames may result in more frequent signals and higher trade frequency, whereas higher time frames will provide fewer but potentially stronger signals.
Conclusion:
The Stochastic RSI Strategy with Inverted Trend Logic is a powerful tool for traders looking to capture market reversals by entering trades against the prevailing trend direction based on momentum exhaustion. Its simple and clear logic, combined with easy-to-understand visual signals, makes it a versatile indicator for both novice and experienced traders.
The Stochastic RSI Strategy with Inverted Trend Logic is a custom-built Pine Script indicator that leverages the Stochastic RSI and a 200-period moving average to generate precise buy and sell signals. It is specifically designed for traders looking to capture opportunities during short-term market movements while factoring in broader trend conditions.
Key Components:
- Stochastic RSI:
- Stochastic RSI is a momentum indicator that applies stochastic calculations to the standard Relative Strength Index (RSI), rather than price data. This makes it particularly sensitive to market momentum changes, which is essential for timing entries and exits.
- K Line and D Line: The indicator calculates and smooths both the K and D lines to capture momentum shifts more accurately.
200-Period Moving Average:
The 200-period Simple Moving Average (SMA) is used as a trend filter.
If the price is above the 200-period SMA, the trend is considered bullish.
If the price is below the 200-period SMA, the trend is considered bearish.
Inverted Trading Logic:
The trading logic is inverted from traditional strategies:
Long trades are executed only when the market is in a bearish trend (price below the 200-period moving average).
Short trades are executed only when the market is in a bullish trend (price above the 200-period moving average).
This inversion allows traders to take advantage of potential trend reversals by entering positions in the opposite direction of the prevailing trend.
Trading Rules:
Long Trade Conditions (Buy Signal):
The Stochastic RSI K line must be below 5 for 4 consecutive candles (oversold condition).
The price must be below the 200-period SMA (indicating a bearish trend).
Once these conditions are met, the indicator will generate a buy signal on the close of the 4th candle.
Exit Condition: The long position is exited when the Stochastic RSI K line crosses above 50 (neutral level).
Short Trade Conditions (Sell Signal):
The Stochastic RSI K line must be above 95 for 4 consecutive candles (overbought condition).
The price must be above the 200-period SMA (indicating a bullish trend).
Once these conditions are met, the indicator will generate a sell signal on the close of the 4th candle.
Exit Condition: The short position is exited when the Stochastic RSI K line crosses below 50.
Visual Signals on the Chart:
Buy Signal:
A green triangle below the bar is displayed on the chart when a buy condition is met, indicating a potential long trade opportunity.
The text "BUY" is displayed for further clarity.
Sell Signal:
A red triangle above the bar is displayed on the chart when a sell condition is met, indicating a potential short trade opportunity.
The text "SELL" is displayed for further clarity.
How to Use the Indicator:
Attach the Indicator: Apply the indicator to your desired chart (works on any time frame, but is optimized for short- to medium-term trading).
Monitor Signals: Watch for buy and sell signals on the chart:
Buy Signal: Enter long positions when a green triangle appears below the candle.
Sell Signal: Enter short positions when a red triangle appears above the candle.
Exit Positions: Exit long positions when the Stochastic RSI crosses above the 50 level, and exit short positions when the Stochastic RSI crosses below the 50 level.
Indicator Display:
Stochastic RSI: A visual representation of the Stochastic RSI (K and D lines) is plotted below the price chart, with overbought (100), midpoint (50), and oversold (0) levels clearly marked.
200-period SMA: The 200-period moving average is plotted on the price chart, giving a clear indication of the broader trend direction (orange line).
Key Benefits:
Reversal Opportunities: This strategy allows traders to capture reversal trades by using an inverted logic where longs are taken in bearish conditions and shorts are taken in bullish conditions. This can help capitalize on potential trend exhaustion and reversals.
Clear and Simple Rules: The use of Stochastic RSI and the 200-period moving average ensures the strategy remains simple yet effective, making it easy for traders to follow.
Visual Alerts: The indicator provides clear buy and sell signals, making it easy for traders to spot trading opportunities in real-time without needing to monitor multiple conditions manually.
Limitations and Considerations:
Trend Changes: Since the strategy is designed to work during trend reversals, it might not perform as well during strong, prolonged trends where price continues moving in one direction without significant pullbacks.
Time Frame Suitability: While the indicator works on any time frame, shorter time frames may result in more frequent signals and higher trade frequency, whereas higher time frames will provide fewer but potentially stronger signals.
Conclusion:
The Stochastic RSI Strategy with Inverted Trend Logic is a powerful tool for traders looking to capture market reversals by entering trades against the prevailing trend direction based on momentum exhaustion. Its simple and clear logic, combined with easy-to-understand visual signals, makes it a versatile indicator for both novice and experienced traders.
Release Notes
This Stochastic RSI Strategy is designed for traders looking to capture reversal opportunities using Stochastic RSI and a 200-period moving average (MA). The strategy generates clear buy/sell signals based on the following conditions:- Long trades: Enter when the Stochastic RSI is below 5 for 4 consecutive candles, and the price is below the 200-period MA (bearish trend).
- Short trades: Enter when the Stochastic RSI is above 95 for 4 consecutive candles, and the price is above the 200-period MA (bullish trend).
Exit trades: Exit long trades when the Stochastic RSI crosses above 50, and exit short trades when the Stochastic RSI crosses below 50.
Key Features:
- Reversal-Based Logic: Inverted logic ensures long trades occur in bearish trends and short trades in bullish trends.
- Visual Buy/Sell Signals: Green arrows for buys and red arrows for sells are plotted directly on the chart.
- Clear Trend Confirmation: The 200-period MA filters out trades that are against the dominant market trend.
🔥 Pro Tip: Combine with Smart Money Concepts
For enhanced precision, use this indicator alongside the Smart Money Concepts Expo indicator:
- Sell in Red Zones: Sell when the indicator triggers and price is in a red zone.
- Buy in Green Zones: Buy when the indicator triggers and price is in a green zone.
This combination allows you to align momentum trades with institutional levels of interest, further improving accuracy and profitability.
Open-source script
In true TradingView spirit, the author of this script has published it open-source, so traders can understand and verify it. Cheers to the author! You may use it for free, but reuse of this code in publication is governed by House rules. You can favorite it to use it on a chart.
Disclaimer
The information and publications are not meant to be, and do not constitute, financial, investment, trading, or other types of advice or recommendations supplied or endorsed by TradingView. Read more in the Terms of Use.