OPEN-SOURCE SCRIPT
COSTAR Strategy [SS]
Updated

A little late posting this but here it is, as promised!
This is the companion to the COSTAR indicator.
What it does:
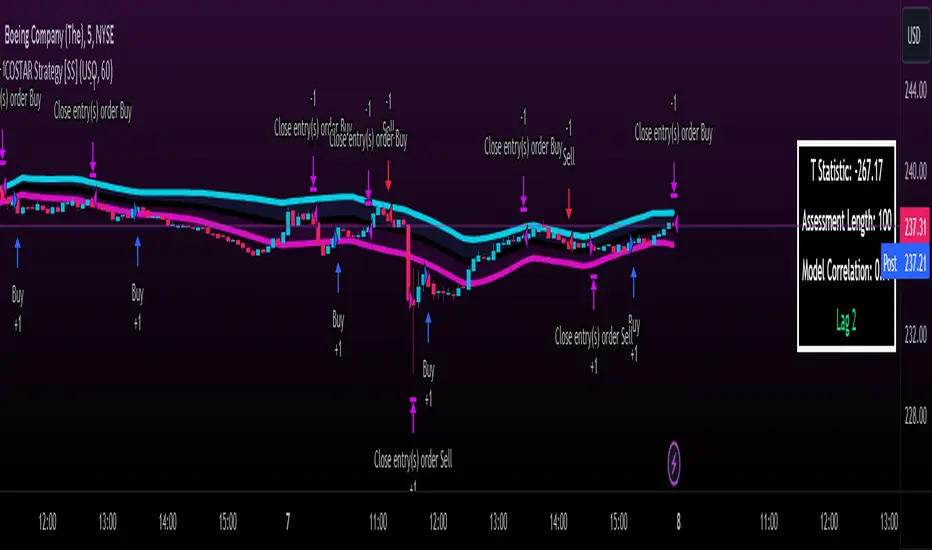
It creates a co-integration paired relationship with a separate, cointegrated ticker. It then plots out the expected range based on the value of the cointegrated pair. When the current ticker is below the value of its co-integrated partner, it becomes a "Buy" and should be longed. When it becomes overvalued in comparison, it becomes a "Sell" and should be shorted.
The example above is with BA and USO, which have a strong inverse relationship.
How it works:
I made the strategy version a bit more intuitive. Instead of you selecting the parameters for your model, it will autoselect the ideal parameters based on your desired co-integrated pair. You simply enter the ticker you want to compare against, and it will sort through the values at various lags to find significance and stationarity. It will then create a model and plot the model out for you on your chart, as you can see above.
The premise of the strategy:
The premise of the strategy is as stated before. You long when the ticker is undervalued in comparison to its co-integrated pair, and short when it is overvalued. The conditions for entry are simply a co-integrated pair being over the expected range (short) or below the expected range (long).
The condition to exit is a "re-integration", or a crossover of the expected value of the ticker (the centreline).
What if it can't find a relationship?
In some instances, the indicator will not be able to determine a co-integrated relationship, owning to a lack of stationarity between the data. When this happens, you will get the following error:

The indicator provides you with prompts, such as switching the timeframe or trying an alternative ticker. In the case displayed above, if we simply switch to the 1 hour timeframe, we have a viable model with great backtest results:

You can toggle in the settings menu the various parameters, such as timeframe, fills and displays.
And that is the strategy in a nutshell, be sure to check out its partner indicator, COSTAR, for more information on the premise of using co-integrated models for trading. And let me know your questions below!
Safe trades everyone!
This is the companion to the COSTAR indicator.
What it does:
It creates a co-integration paired relationship with a separate, cointegrated ticker. It then plots out the expected range based on the value of the cointegrated pair. When the current ticker is below the value of its co-integrated partner, it becomes a "Buy" and should be longed. When it becomes overvalued in comparison, it becomes a "Sell" and should be shorted.
The example above is with BA and USO, which have a strong inverse relationship.
How it works:
I made the strategy version a bit more intuitive. Instead of you selecting the parameters for your model, it will autoselect the ideal parameters based on your desired co-integrated pair. You simply enter the ticker you want to compare against, and it will sort through the values at various lags to find significance and stationarity. It will then create a model and plot the model out for you on your chart, as you can see above.
The premise of the strategy:
The premise of the strategy is as stated before. You long when the ticker is undervalued in comparison to its co-integrated pair, and short when it is overvalued. The conditions for entry are simply a co-integrated pair being over the expected range (short) or below the expected range (long).
The condition to exit is a "re-integration", or a crossover of the expected value of the ticker (the centreline).
What if it can't find a relationship?
In some instances, the indicator will not be able to determine a co-integrated relationship, owning to a lack of stationarity between the data. When this happens, you will get the following error:
The indicator provides you with prompts, such as switching the timeframe or trying an alternative ticker. In the case displayed above, if we simply switch to the 1 hour timeframe, we have a viable model with great backtest results:
You can toggle in the settings menu the various parameters, such as timeframe, fills and displays.
And that is the strategy in a nutshell, be sure to check out its partner indicator, COSTAR, for more information on the premise of using co-integrated models for trading. And let me know your questions below!
Safe trades everyone!
Release Notes
Quick fix on one of the lag variables (the lag was not matching). Open-source script
In true TradingView spirit, the author of this script has published it open-source, so traders can understand and verify it. Cheers to the author! You may use it for free, but reuse of this code in publication is governed by House rules. You can favorite it to use it on a chart.
For real-time updates and premium indicators, consider joining my group at: patreon.com/steversteves
Disclaimer
The information and publications are not meant to be, and do not constitute, financial, investment, trading, or other types of advice or recommendations supplied or endorsed by TradingView. Read more in the Terms of Use.