OPEN-SOURCE SCRIPT
Season Chart

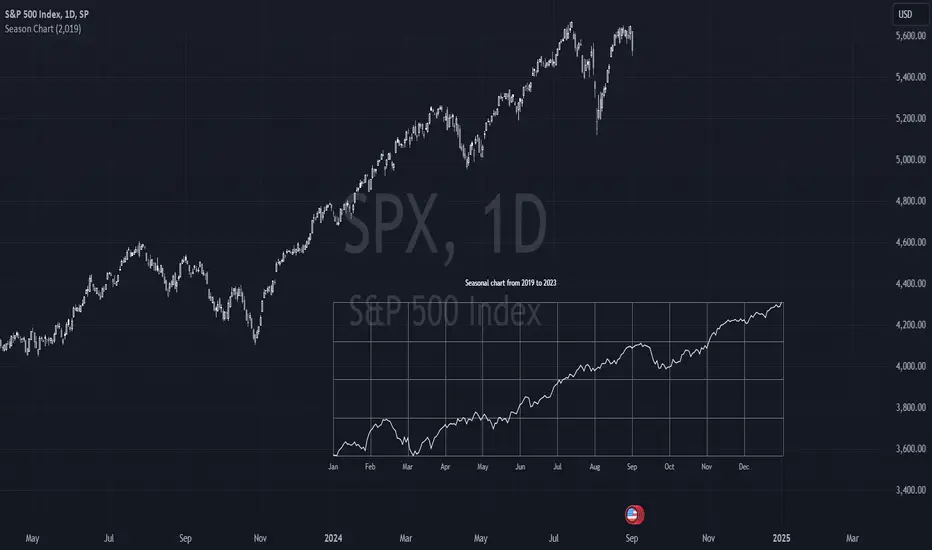
This overlay is built on the idea of seasonal charts.
It is constructed by taking the percentage change from each close and recording that change for every trading day of any year that is within the sample. We then take the average for each day of all the years.
These averages are then cumulated to create the chart as per traditional seasonal chart construction.
I have also taken a trimmed mean of the averages to try and dampen the impact one off moves that may have a dramatic effect on the daily averages (for example the crash to $0 in oil in April 2020) however, even removing 10% may not guarantee one off moves won’t affect the average.
The construction of the chart is completely dependent on the data provided by TradingView and so it is recommended that if longer sample sizes are used, the user go back to check that the years contained within the sample have a full history. Some data may have large gaps in their history and this can distort the seasonality readings.
I have attempted to align the chart with the first trading day of the year, but the start of some months may be out by a day or two as it becomes difficult to track all weeks with differing market holidays closures each year and this in turn varies the total amount of actual trading days in each year as well as leap years.
This overlay is designed for the Daily time frame only and will not work on Crypto or any other instrument that trades outside of usual business weekdays. Future updates may include the ability to adapt to Crypto instruments.
All feedback and comments welcome!
Open-source script
In true TradingView spirit, the author of this script has published it open-source, so traders can understand and verify it. Cheers to the author! You may use it for free, but reuse of this code in publication is governed by House rules. You can favorite it to use it on a chart.
Disclaimer
The information and publications are not meant to be, and do not constitute, financial, investment, trading, or other types of advice or recommendations supplied or endorsed by TradingView. Read more in the Terms of Use.