OPEN-SOURCE SCRIPT
UCS_TTM_Wave A & B & C
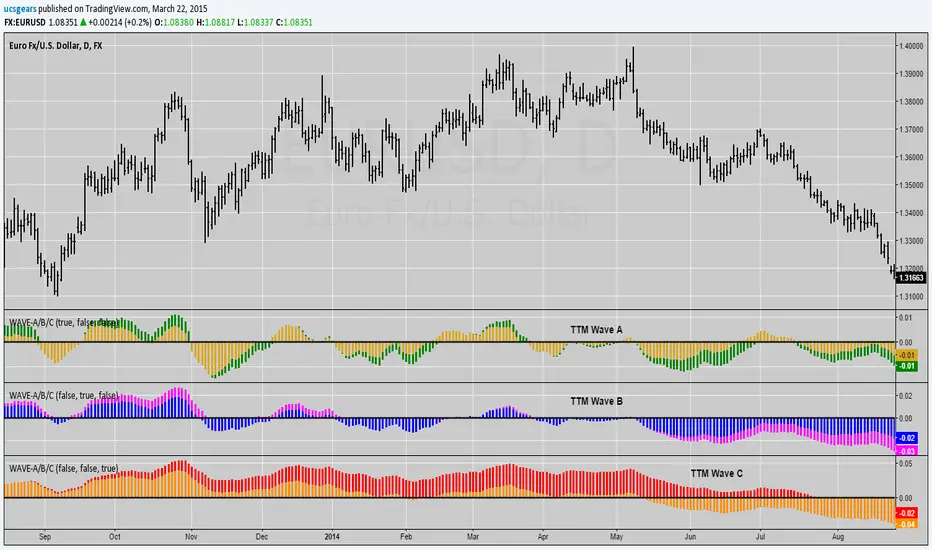
This is a replica of TTM Wave A B C.
The ABC Waves are comprised of various moving averages and oscillators (MACD) used to visualize the overall strength and direction of a given market across multiple time frames.
The “A Wave” measures short term relative strength and direction of a market, the “C Wave” measures longer term strength and the “B Wave” plots the same for a medium time period.
Here is the link to the ACTUAL Indicator - members.simpleroptions.com/options-trading-indicators/abcwaves/
Instruction -
Load the Indicator three times, Turn Off the Other two Waves. For eg., Wave A - Check / Wave B - Uncheck / Wave C - Uncheck. = This will plot Wave A.
Open-source script
In true TradingView spirit, the creator of this script has made it open-source, so that traders can review and verify its functionality. Kudos to the author! While you can use it for free, remember that republishing the code is subject to our House Rules.
For quick access on a chart, add this script to your favorites — learn more here.
Uday C Santhakumar
Disclaimer
The information and publications are not meant to be, and do not constitute, financial, investment, trading, or other types of advice or recommendations supplied or endorsed by TradingView. Read more in the Terms of Use.