OPEN-SOURCE SCRIPT
Support & Resistance Analyzer
Updated
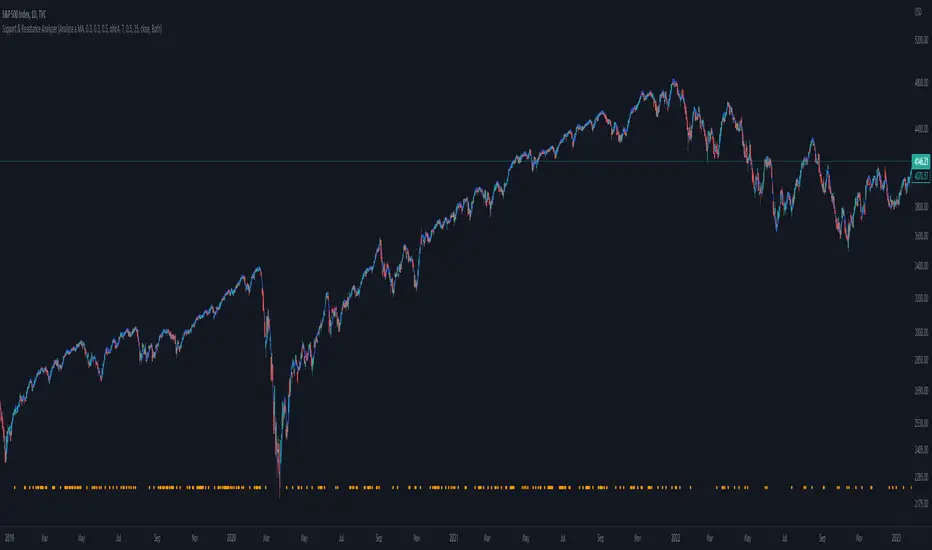
This script analyzes the effectiveness of support and resistance (S&R) levels by examining their impact on price action. It measures the compression or reversion of price action around these levels to determine their overall performance.
To use the script, simply copy and paste the Moving Average (MA) or desired level script that you want to test. The results will be displayed in the data window for easy reference.
The script provides a metric called S&R overperformance or underperformance, which offers a concise summary of the S&R level's effectiveness. This metric is determined by comparing the price action near the S&R level to the overall price action throughout the dataset.
Additionally, the script includes specific metrics to further illustrate how the S&R level affects the price. These metrics provide more detailed insights into the S&R's influence on price action, enabling users to make better-informed decisions when applying S&R levels to their trading strategies.
Release Notes
Minor fix for the inputs optionsRelease Notes
Fix a coding mistake Added the possibility of analyzing the S&R levels directionally.
Meaning when a candle is going up and the close is below the S&R and viceversa
Release Notes
Few changes to optimize the code Made the zones and contacts visible
Open-source script
In true TradingView spirit, the author of this script has published it open-source, so traders can understand and verify it. Cheers to the author! You may use it for free, but reuse of this code in publication is governed by House rules. You can favorite it to use it on a chart.
Disclaimer
The information and publications are not meant to be, and do not constitute, financial, investment, trading, or other types of advice or recommendations supplied or endorsed by TradingView. Read more in the Terms of Use.