PROTECTED SOURCE SCRIPT
Consolidation Range Detector [Pt]
Updated
█ Author's Note:
After extensively reviewing the existing consolidation detection tools in the TradingView library, I found that none fully met my expectations. Some tools were overly sensitive, producing too many invalid ranges, while others lacked the necessary sensitivity. Consequently, I decided to develop my own tool. I hope that you, fellow traders, find it valuable and enjoy using it.
█ Description:
The Consolidation Range Detector [Pt] is a sophisticated TradingView tool designed to identify and visualize periods of price consolidation on any financial chart. This indicator employs advanced algorithms to detect ranges where price movements are confined, helping traders spot potential breakout zones and make informed trading decisions.
█ Key Features:
► Customizable Detection Sensitivity: Adjust the sensitivity of the detection algorithm to suit your trading strategy, ensuring a precise fit within the consolidation range.
► Dynamic Coloring: Choose between random or fixed colors for the consolidation ranges, with options to match different background color schemes (Dark, Light, Neutral).
► Visual Clarity: Highlight detected consolidation ranges directly on the chart with customizable color schemes to enhance visibility and provide clear visual cues.
► ATR-Based Validation: Ensures detected consolidation ranges are significant and reliable by using the Average True Range (ATR) for validation.
█ User-Defined Inputs:
► Minimum Detection Bars: Set the minimum number of bars required to detect a consolidation range.
► Max Range Multiplier: Define the maximum range for detection as a multiple of the ATR.
► Detection Sensitivity: Adjust the sensitivity of the detection algorithm. Higher values mean a tighter fit within the consolidation range.
► Color Options: Choose the color for the consolidation range boxes and decide whether to use random colors.
► Color Scheme (Background): Select a color scheme for the chart background (Dark, Light, Neutral).
█ How It Works:
► Range Detection: The indicator scans the chart for potential consolidation ranges based on user-defined parameters. It calculates the average price and ATR to determine the significance of the range.
► Validation: Each detected range is validated based on criteria such as ATR threshold, range validity, average price comparison, and the number of touches at the range boundaries.
► Visualization: Validated ranges are highlighted on the chart with colored boxes, providing a clear visual cue of potential consolidation zones.
█ Usage Examples:
► Example 1:
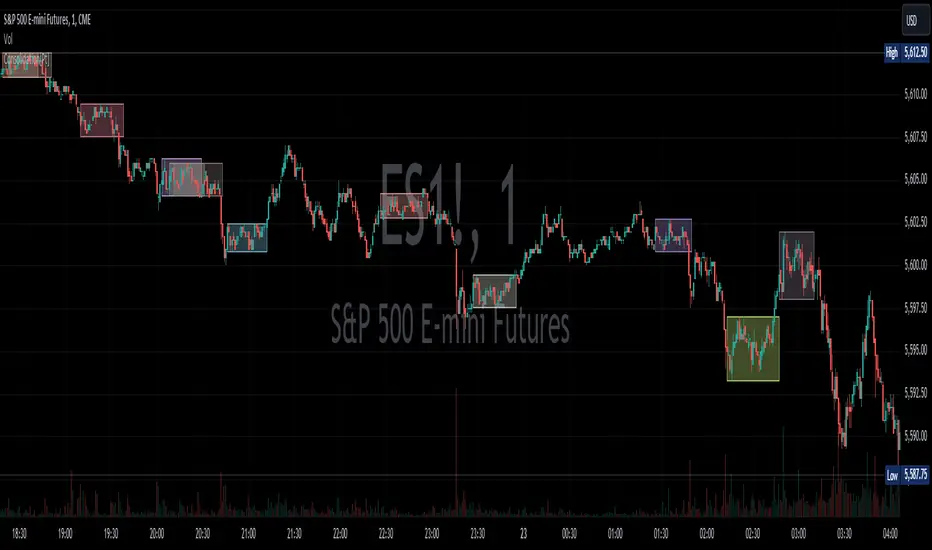
The image below showcases the Consolidation Range Detector [Pt] in action on a chart of S&P 500 E-mini Futures. The indicator highlights several consolidation ranges with different colors, demonstrating its ability to adapt to varying market conditions and visually emphasize key areas of price consolidation. The annotations for breakouts and price reactions are manually marked to illustrate the practical application of the tool in identifying potential trading opportunities based on these key areas.

█ Practical Applications:
► Identify Breakout Zones: Use the detected consolidation ranges to identify potential breakout zones, helping to anticipate significant price movements.
► Identify Key Price Levels: The tool helps in pinpointing key price levels where there is a high probability of significant price reactions, providing crucial insights for trading strategies.
► Enhance Technical Analysis: Integrate the Consolidation Range Detector into your existing technical analysis toolkit to improve the accuracy of your trading decisions.
█ Conclusion:
The Consolidation Range Detector [Pt] is a powerful tool for traders looking to identify periods of price consolidation and potential breakout zones. With its customizable settings and advanced detection algorithms, it provides a reliable and visual method to enhance your trading strategy. Whether you're a beginner or an experienced trader, this indicator can add significant value to your technical analysis.
█ Cautionary Note:
While the Consolidation Range Detector [Pt] is a powerful tool, it's important to combine it with other indicators and analysis methods for comprehensive trading decisions. Always consider market context and external factors when interpreting detected consolidation ranges.
After extensively reviewing the existing consolidation detection tools in the TradingView library, I found that none fully met my expectations. Some tools were overly sensitive, producing too many invalid ranges, while others lacked the necessary sensitivity. Consequently, I decided to develop my own tool. I hope that you, fellow traders, find it valuable and enjoy using it.
█ Description:
The Consolidation Range Detector [Pt] is a sophisticated TradingView tool designed to identify and visualize periods of price consolidation on any financial chart. This indicator employs advanced algorithms to detect ranges where price movements are confined, helping traders spot potential breakout zones and make informed trading decisions.
█ Key Features:
► Customizable Detection Sensitivity: Adjust the sensitivity of the detection algorithm to suit your trading strategy, ensuring a precise fit within the consolidation range.
► Dynamic Coloring: Choose between random or fixed colors for the consolidation ranges, with options to match different background color schemes (Dark, Light, Neutral).
► Visual Clarity: Highlight detected consolidation ranges directly on the chart with customizable color schemes to enhance visibility and provide clear visual cues.
► ATR-Based Validation: Ensures detected consolidation ranges are significant and reliable by using the Average True Range (ATR) for validation.
█ User-Defined Inputs:
► Minimum Detection Bars: Set the minimum number of bars required to detect a consolidation range.
► Max Range Multiplier: Define the maximum range for detection as a multiple of the ATR.
► Detection Sensitivity: Adjust the sensitivity of the detection algorithm. Higher values mean a tighter fit within the consolidation range.
► Color Options: Choose the color for the consolidation range boxes and decide whether to use random colors.
► Color Scheme (Background): Select a color scheme for the chart background (Dark, Light, Neutral).
█ How It Works:
► Range Detection: The indicator scans the chart for potential consolidation ranges based on user-defined parameters. It calculates the average price and ATR to determine the significance of the range.
► Validation: Each detected range is validated based on criteria such as ATR threshold, range validity, average price comparison, and the number of touches at the range boundaries.
► Visualization: Validated ranges are highlighted on the chart with colored boxes, providing a clear visual cue of potential consolidation zones.
█ Usage Examples:
► Example 1:
The image below showcases the Consolidation Range Detector [Pt] in action on a chart of S&P 500 E-mini Futures. The indicator highlights several consolidation ranges with different colors, demonstrating its ability to adapt to varying market conditions and visually emphasize key areas of price consolidation. The annotations for breakouts and price reactions are manually marked to illustrate the practical application of the tool in identifying potential trading opportunities based on these key areas.
█ Practical Applications:
► Identify Breakout Zones: Use the detected consolidation ranges to identify potential breakout zones, helping to anticipate significant price movements.
► Identify Key Price Levels: The tool helps in pinpointing key price levels where there is a high probability of significant price reactions, providing crucial insights for trading strategies.
► Enhance Technical Analysis: Integrate the Consolidation Range Detector into your existing technical analysis toolkit to improve the accuracy of your trading decisions.
█ Conclusion:
The Consolidation Range Detector [Pt] is a powerful tool for traders looking to identify periods of price consolidation and potential breakout zones. With its customizable settings and advanced detection algorithms, it provides a reliable and visual method to enhance your trading strategy. Whether you're a beginner or an experienced trader, this indicator can add significant value to your technical analysis.
█ Cautionary Note:
While the Consolidation Range Detector [Pt] is a powerful tool, it's important to combine it with other indicators and analysis methods for comprehensive trading decisions. Always consider market context and external factors when interpreting detected consolidation ranges.
Release Notes
◊ Minor Bug fixed- Ranges weren't extending as far as possible while price are still in range. With bug fixed, the last candle of a range should be a breakout candle outside of ATR threshold.
Release Notes
◊ Minor Bug fixedSame as last update. Very minor tweak in script.
If you make $$$ off it, consider donating some of your juicy gain :)
Buy me a coffee - buymeacoffee.com/PtGambler
PayPal - paypal.me/PtGambler
You can reach me privately through my Discord Channel: discord.gg/WMQfaVGyQC
Buy me a coffee - buymeacoffee.com/PtGambler
PayPal - paypal.me/PtGambler
You can reach me privately through my Discord Channel: discord.gg/WMQfaVGyQC
Disclaimer
The information and publications are not meant to be, and do not constitute, financial, investment, trading, or other types of advice or recommendations supplied or endorsed by TradingView. Read more in the Terms of Use.