OPEN-SOURCE SCRIPT
COVID-19: Daily change
Updated
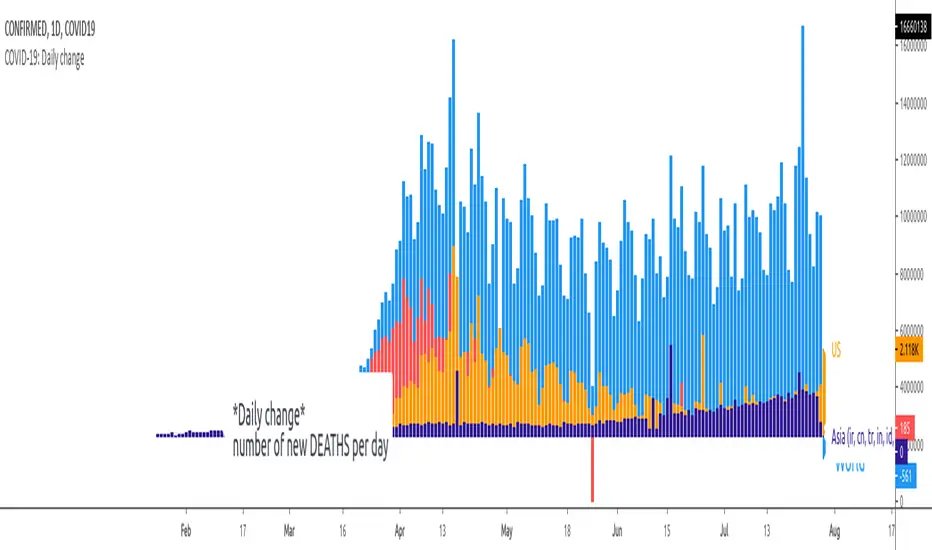
New daily infections (daily change) of COVID-19.
The chart shows new daily cases across the entire planet, the US, EU (de+fr+it+es only) and a small country (RO) that does not matter to anybody but me. You can show/hide different country in Settings.
Select "COVID-19: CONFIRMED" data in main chart and add the indicator.
The chart shows new daily cases across the entire planet, the US, EU (de+fr+it+es only) and a small country (RO) that does not matter to anybody but me. You can show/hide different country in Settings.
Select "COVID-19: CONFIRMED" data in main chart and add the indicator.
Release Notes
## [0.0.2] - 2020-03-28Added:
- Asia: including China and Korea
- UK
- Switzerland (CH) to EU - it shows new 1k per day
Changed:
- split big legend into small labels for each data source
Removed:
- RO is hidden by default
Release Notes
# ChangelogYou can use any data source (I use "COVID19: CONFIRMED" or "COVID19: DEATHS") but you need to disconnect main chart from right scale: More (the 3 dots) - Pin to scale - No Scale.
## [0.0.3] - 2020-03-30
### Added
- NL with more than 1k cases / day
- BE that has more than 10k total cases
### Changed
- smaller text in legend
- Asia is displayed by default
- UK is no longer showing by default
Release Notes
# Changelog## 0.0.4 - 2020-04-01
### Added
- Austria (AT) with more than 10k total cases and 9M population
### Changed
- UK showing by default
- fix columns chart for BE and NL
Release Notes
# Changelog## 0.0.5 - 20200405
### Added
- Portugal, PT - with more than 10k total cases
- Canada, CA - more than 1k cases per day
### Changed
- refactoring and DRY the code
- relative/dynamic position for all labels
Release Notes
Toggle between new deaths/confirmed, add Sweden (SE).Release Notes
Adding Iran, Turkey, India, Indonesia, each of them with more than 1k deathsRelease Notes
Fix GB series name and remove COVID-19 prefixRelease Notes
Fix GB series name, apply module operation to remove outliers from bad data series.Open-source script
In true TradingView spirit, the author of this script has published it open-source, so traders can understand and verify it. Cheers to the author! You may use it for free, but reuse of this code in publication is governed by House rules. You can favorite it to use it on a chart.
Disclaimer
The information and publications are not meant to be, and do not constitute, financial, investment, trading, or other types of advice or recommendations supplied or endorsed by TradingView. Read more in the Terms of Use.