OPEN-SOURCE SCRIPT
TTP NVT Studio
Updated
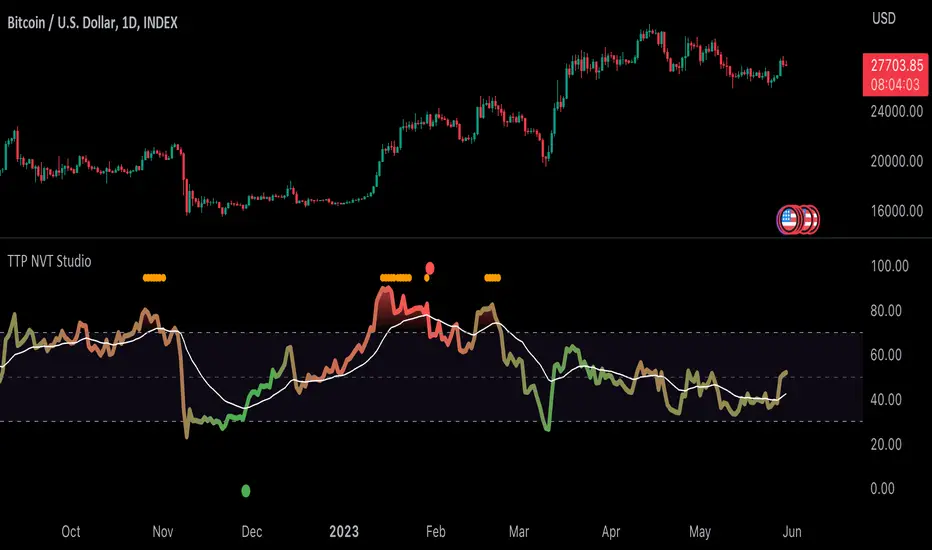
NVT Studio is an indicator that aims to find areas of reversal of the Bitcoin price based on the extreme areas of Network Value Transaction.
Instructions:
- We recommend using it on BTCUSD
- Use the daily or weekly timeframe
The indicator works as an oscillator and offers to visualisation modes.
1) Showing the short term oscillations of NVT showing signals in potential areas of reversal.
2) The actual value of NVT displayed. When in green is an area of value and in red when its overextended.
This indicator can be used based on the signals or based on breakouts of trend lines drawn in the oscillator mode.
Red/green dots: signal type 1 - extremes with confirmation, these might trigger late
Yellow/Orange: signal type 2 - extremes without confirmation, might trigger too soon
Instructions:
- We recommend using it on
- Use the daily or weekly timeframe
The indicator works as an oscillator and offers to visualisation modes.
1) Showing the short term oscillations of NVT showing signals in potential areas of reversal.
2) The actual value of NVT displayed. When in green is an area of value and in red when its overextended.
This indicator can be used based on the signals or based on breakouts of trend lines drawn in the oscillator mode.
Red/green dots: signal type 1 - extremes with confirmation, these might trigger late
Yellow/Orange: signal type 2 - extremes without confirmation, might trigger too soon
Release Notes
Added support for alerts and look tweaks, enjoy 🦜Release Notes
Support for using a single alert to send all events by using the "any alert function call".Release Notes
QUANDL was removed from tradingview. We were using this data source to pull their BTC market cap and estimated transaction volume for BTC but unfortunately is no longer available.
For now I'll be using data from coin metrics since its the closest it can get to the actual NVT chart while I investigate better options, ask other NVT authors what are they currently using, etc.
We need a good source of "Estimated Transaction Volume in USD". We were using 'QUANDL:BCHAIN/ETRVU' symbol.
Join our membership to gain access to the private scripts.
thetradingparrot.com
thetradingparrot.com
Open-source script
In true TradingView spirit, the author of this script has published it open-source, so traders can understand and verify it. Cheers to the author! You may use it for free, but reuse of this code in publication is governed by House rules. You can favorite it to use it on a chart.
Disclaimer
The information and publications are not meant to be, and do not constitute, financial, investment, trading, or other types of advice or recommendations supplied or endorsed by TradingView. Read more in the Terms of Use.