OPEN-SOURCE SCRIPT
Volume Volatility Spectrum
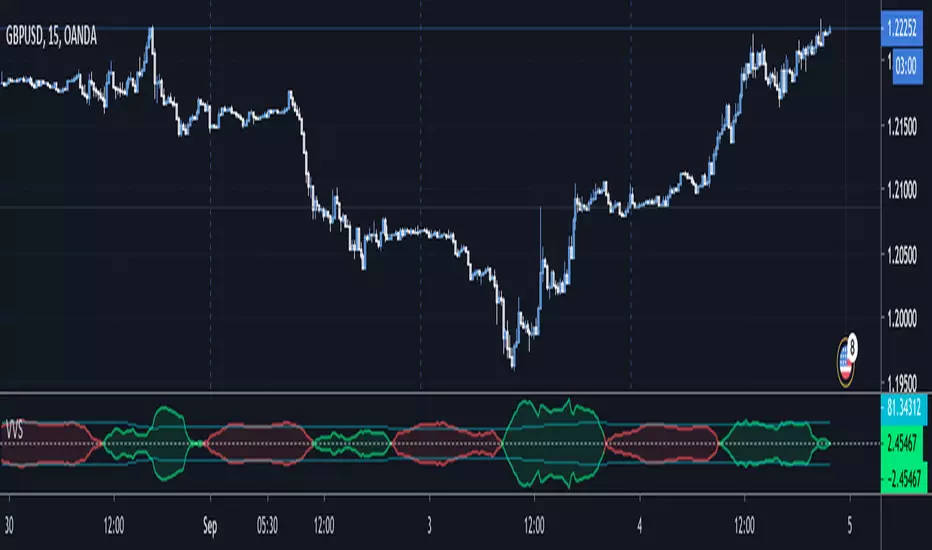
This indicator estimates price volatility and it is based on Volume only (presumably Tick Volume in Forex).
Tick volume is supposed to be a good proxy to actual volume in spot forex (study of Caspar Marney, 2011)
The advantage of this indicator is that it can be used with any pair, any timeframe.
The only parameters are the periods of the reference Volume Moving Average and the fast Volume MA.
The fluctuations of a short period Volume MA with respect to a gently MA with high period
are calculated.
RED areas depict low volatility
GREEN areas depict high volatility.
When the clouds are outside the region delimited by the aqua lines we have extreme conditions:
Extremely low volatility = red cloud outside the aqua bands
Extremely high volatility = green cloud outside the aqua bands
Vitelot/yanez/Vts September 2019.
Compare this indicator with the ATR Volatility Spectrum of myself
Open-source script
In true TradingView spirit, the author of this script has published it open-source, so traders can understand and verify it. Cheers to the author! You may use it for free, but reuse of this code in publication is governed by House rules. You can favorite it to use it on a chart.
Disclaimer
The information and publications are not meant to be, and do not constitute, financial, investment, trading, or other types of advice or recommendations supplied or endorsed by TradingView. Read more in the Terms of Use.