PROTECTED SOURCE SCRIPT
Gann Bursa Malaysia Ver1
Updated
Gann Square of 9 is a spiral of numbers starting with the number one in the center.
The numbers spiral around the center in a clockwise manner to the number 9, which completes the first cycle around the center.
Square of 9 Wheel is one of the popular market tools of legendary trader W.D. Gann
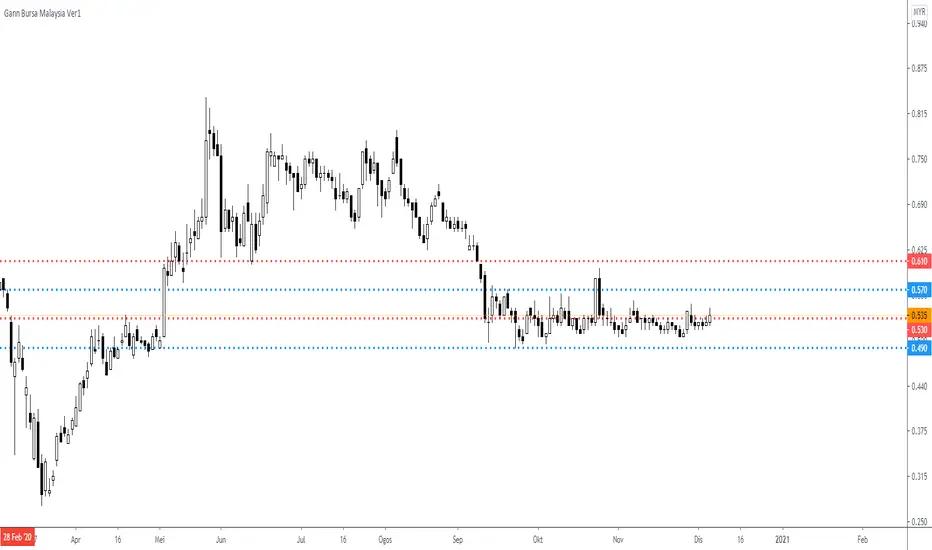
Based on Gann Square of 9, this indicator automatically plot the lines which act as support and resistance .
Red Line - very strong support/resistance
Blue Line - strong support/resistance
Notes :
These indicator only suitable for Bursa Malaysia.
Currently Only Cover Price Range( RM ) from 0.020 - 2.50
The numbers spiral around the center in a clockwise manner to the number 9, which completes the first cycle around the center.
Square of 9 Wheel is one of the popular market tools of legendary trader W.D. Gann
Based on Gann Square of 9, this indicator automatically plot the lines which act as support and resistance .
Red Line - very strong support/resistance
Blue Line - strong support/resistance
Notes :
These indicator only suitable for Bursa Malaysia.
Currently Only Cover Price Range( RM ) from 0.020 - 2.50
Release Notes
Gann Square of 9 is a spiral of numbers starting with the number one in the center.The numbers spiral around the center in a clockwise manner to the number 9, which completes the first cycle around the center.
Square of 9 Wheel is one of the popular market tools of legendary trader W.D. Gann
Based on Gann Square of 9, this indicator automatically plot the lines which act as support and resistance .
Red Line - very strong support/resistance
Blue Line - strong support/resistance
Notes :
These indicator only suitable for Bursa Malaysia.
Currently Only Cover Price Range( RM ) from 0.020 - 2.50
Release Notes
Update : Option input for line widthRelease Notes
27/6/2020- Update price until RM4
( Kemas-kini line Gan merangkumi paras sehingga RM4 )
Release Notes
.Disclaimer
The information and publications are not meant to be, and do not constitute, financial, investment, trading, or other types of advice or recommendations supplied or endorsed by TradingView. Read more in the Terms of Use.