5ADR - Average Range of Last 5 Candlesticks
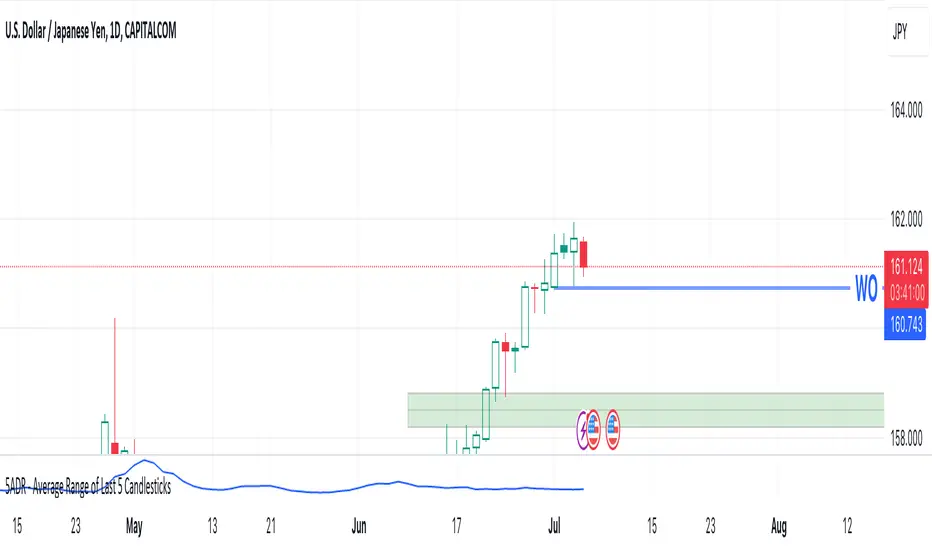
Average Daily Range (ADR) Indicator for the Last 5 Days
This script calculates the Average Daily Range (ADR) for the last 5 trading days. It helps traders to understand the average movement in pips, providing insights into potential price movements.
How to Use:
Set Chart to Daily Timeframe: Ensure your chart is set to the daily timeframe.
Hover Over Previous Day: To see the ADR for today, hover your mouse over the previous trading day.
For example, if today is Tuesday, hover over Monday to see the ADR for Tuesday.
Read ADR in Blue: The ADR will be displayed on the left side of the chart in blue color.
Disclaimer
The information and publications are not meant to be, and do not constitute, financial, investment, trading, or other types of advice or recommendations supplied or endorsed by TradingView. Read more in the Terms of Use.