PROTECTED SOURCE SCRIPT
MTF TZ-CX
Updated
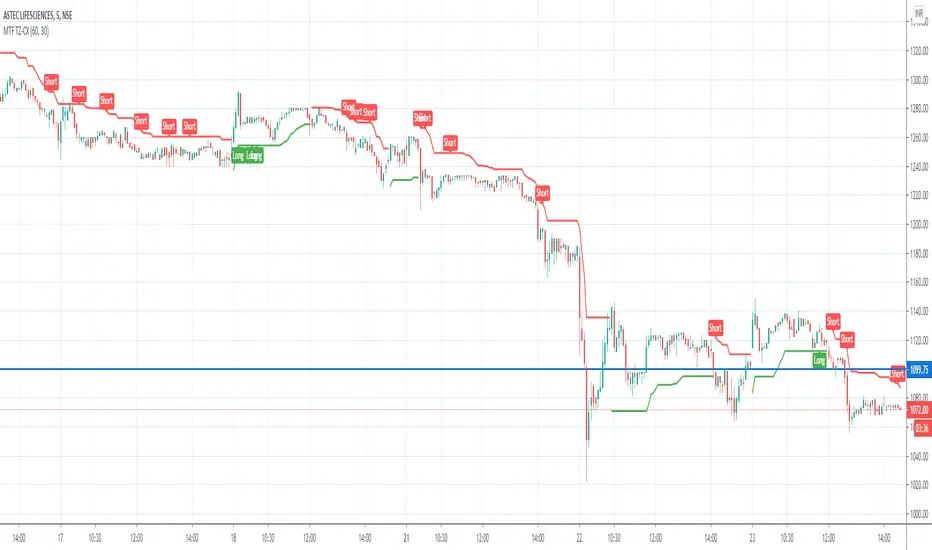
This is a Beta version of Trend Indicator using Multi Time Frame Analysis to suggest a long or a short
the main use of this indicator is quick scalping and Intra-day trading.
The Indicator shows the option to show the Trend Zone and Buy/Sell Signals which the use can on or off
Also to avoid false positives we have introduced a double check using RSI,
it is defaulted to 60/30 - the users are free to change it as per their preferences
The system will not suggest a trade when the the counter in inside the RSI limits
Stop Loss - That should be done by following ones risk appetite , Ideally the open/close of the previous candle should be the stop loss for the buy/sell
but everyone has their own Risk Management Strategies based on the capital deployed.
Disclaimer : There could be scenarios when the candle is shown as a long or short and then the candle turns into opposite direction red/green .
In such scenarios , Please refer to the just preceding candle and if this candle is moving into positive direction (forming green candle) only then buy ,
Similarly Sell/Short only if this candle is forming a red candle
Release Notes
Update 2nd Aug 2020Removed the Input Option : Show SMA Tick as the usage was deprecated
Added Flexibility on RSI : Now you could set the Overbought region to 50 - 80
Now you could set the Overbought region to 20 - 50
Note : The RSI is not a standard time frame RSI , but a more hybrid RSI using derivative of Multiple RSI
If you like it and find it useful or if you find a defect or bug , Please let us know in the comments .. that would encouraging !!
Release Notes
Release Notes : 30th Aug 2020Updated Access Setting
Cosmetic Fixes
Release Notes
Update : Trending logic changes , Release Notes
Updated Date Validation conditions Disclaimer
The information and publications are not meant to be, and do not constitute, financial, investment, trading, or other types of advice or recommendations supplied or endorsed by TradingView. Read more in the Terms of Use.